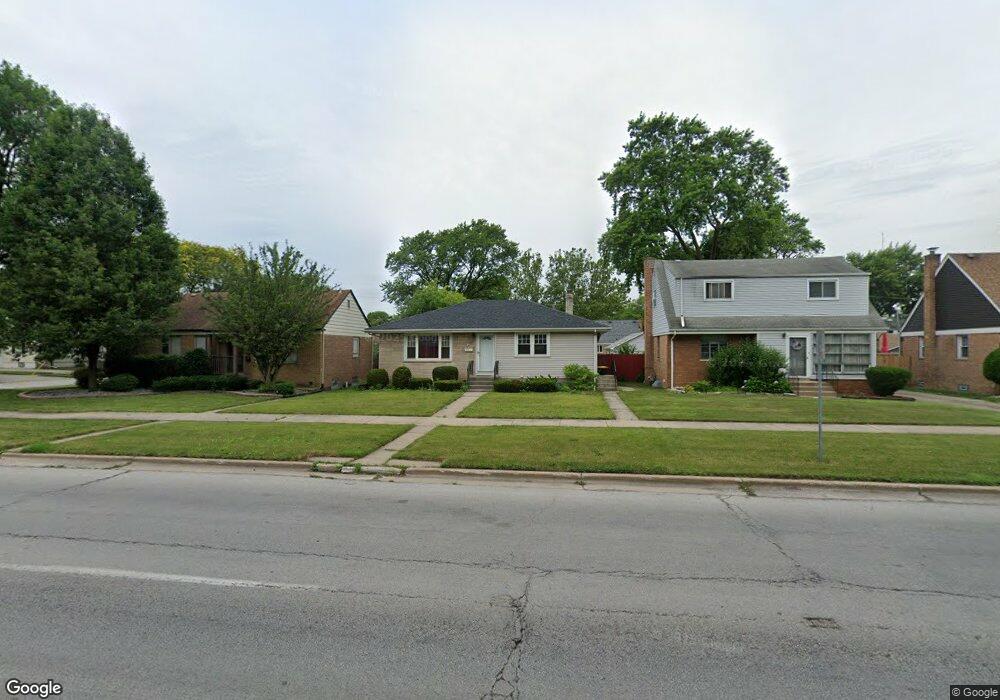
17552 Burnham Ave Lansing, IL 60438
Estimated Value: $177,368 - $231,000
3
Beds
1
Bath
1,006
Sq Ft
$200/Sq Ft
Est. Value
About This Home
This home is located at 17552 Burnham Ave, Lansing, IL 60438 and is currently estimated at $201,092, approximately $199 per square foot. 17552 Burnham Ave is a home located in Cook County with nearby schools including Coolidge Elementary School, Memorial Jr High School, and Thornton Fractnl So High School.
Ownership History
Date
Name
Owned For
Owner Type
Purchase Details
Closed on
May 17, 2005
Sold by
Mb Financial Bank Na
Bought by
Alvarez Maria D
Current Estimated Value
Home Financials for this Owner
Home Financials are based on the most recent Mortgage that was taken out on this home.
Original Mortgage
$116,800
Outstanding Balance
$61,720
Interest Rate
6.05%
Mortgage Type
Fannie Mae Freddie Mac
Estimated Equity
$139,372
Purchase Details
Closed on
Jan 5, 2001
Sold by
South Holland Trust & Svgs Bank
Bought by
South Holland Trust & Svgs Bank and Trust #12129
Purchase Details
Closed on
Oct 4, 2000
Sold by
South Holland Trust & Svgs Bank
Bought by
South Holland Trust & Svgs Bank and Trust #12028
Create a Home Valuation Report for This Property
The Home Valuation Report is an in-depth analysis detailing your home's value as well as a comparison with similar homes in the area
Home Values in the Area
Average Home Value in this Area
Purchase History
| Date | Buyer | Sale Price | Title Company |
|---|---|---|---|
| Alvarez Maria D | $146,000 | Ticor Title | |
| South Holland Trust & Svgs Bank | -- | -- | |
| South Holland Trust & Svgs Bank | $115,000 | -- |
Source: Public Records
Mortgage History
| Date | Status | Borrower | Loan Amount |
|---|---|---|---|
| Open | Alvarez Maria D | $116,800 | |
| Closed | Alvarez Maria D | $24,800 |
Source: Public Records
Tax History Compared to Growth
Tax History
| Year | Tax Paid | Tax Assessment Tax Assessment Total Assessment is a certain percentage of the fair market value that is determined by local assessors to be the total taxable value of land and additions on the property. | Land | Improvement |
|---|---|---|---|---|
| 2024 | $1,744 | $5,264 | $1,328 | $3,936 |
| 2023 | $1,861 | $5,264 | $1,328 | $3,936 |
| 2022 | $1,861 | $4,576 | $1,172 | $3,404 |
| 2021 | $1,839 | $4,574 | $1,171 | $3,403 |
| 2020 | $1,774 | $4,574 | $1,171 | $3,403 |
| 2019 | $1,950 | $5,140 | $1,093 | $4,047 |
| 2018 | $1,912 | $5,140 | $1,093 | $4,047 |
| 2017 | $1,948 | $5,140 | $1,093 | $4,047 |
| 2016 | $1,838 | $4,610 | $1,015 | $3,595 |
| 2015 | $1,676 | $4,610 | $1,015 | $3,595 |
| 2014 | $1,666 | $4,610 | $1,015 | $3,595 |
| 2013 | $1,769 | $5,243 | $1,015 | $4,228 |
Source: Public Records
Map
Nearby Homes
- 17557 Burnham Ave
- 17518 Roy St
- 17415 Burnham Ave
- 3127 Bernice Rd Unit 2
- 3127 Bernice Rd Unit 6
- 17419 Walter St
- 17603 Community St
- 17519 Community St
- 17745 Burnham Ave
- 3425 Bernice Ave
- 17701 Park Blvd Unit 103
- 3026 Bernice Rd Unit 308
- 3010 Bernice Rd Unit 303
- 17724 Henry St
- 17317 Roy St
- 17331 Community St
- 2950 Bernice Rd
- 17303 Roy St
- 17303 Chicago Ave
- 3409 173rd Place
- 17552 Burnham Ave
- 17548 Burnham Ave
- 17548 Burnham Ave
- 17558 Burnham Ave
- 17542 Burnham Ave
- 17536 Burnham Ave
- 17536 Burnham Ave
- 17547 Greenbay Ave
- 17551 Greenbay Ave
- 17557 Greenbay Ave
- 17537 Greenbay Ave
- 17532 Burnham Ave
- 17532 Burnham Ave
- 17606 Burnham Ave
- 3153 176th St
- 17553 Burnham Ave
- 17553 Burnham Ave
- 17549 Burnham Ave
- 17549 Burnham Ave