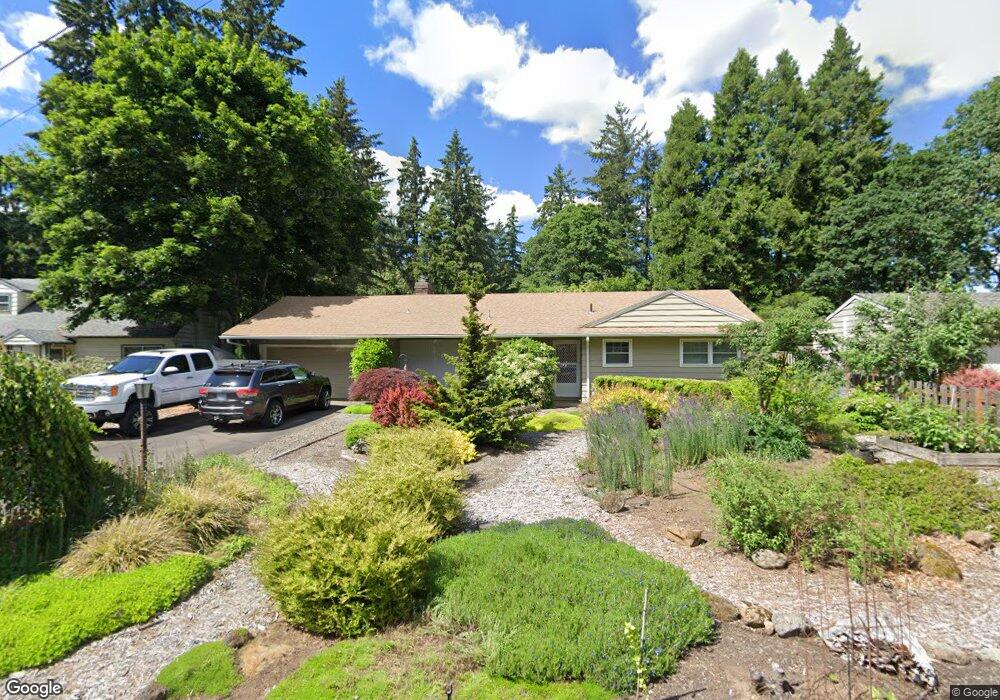
17555 Deemar Way Lake Oswego, OR 97035
Bryant NeighborhoodEstimated Value: $566,259 - $689,000
3
Beds
2
Baths
1,116
Sq Ft
$544/Sq Ft
Est. Value
About This Home
This home is located at 17555 Deemar Way, Lake Oswego, OR 97035 and is currently estimated at $606,815, approximately $543 per square foot. 17555 Deemar Way is a home located in Clackamas County with nearby schools including River Grove Elementary School, Lakeridge Middle School, and Lakeridge High School.
Ownership History
Date
Name
Owned For
Owner Type
Purchase Details
Closed on
Feb 29, 2012
Sold by
Taylor Teresa Ann and Francis Teresa T
Bought by
Ant Ventures Llc
Current Estimated Value
Purchase Details
Closed on
Dec 11, 2007
Sold by
Taylor Teresa Ann
Bought by
Ant Ventures Llc
Purchase Details
Closed on
Feb 14, 2007
Sold by
Grahams Ferry Road Property Llc
Bought by
S Lawrences Grahams Ferry Llc
Purchase Details
Closed on
Mar 21, 1997
Sold by
Morrow Dustin and Morrow Laurie
Bought by
Taylor Teresa Ann
Home Financials for this Owner
Home Financials are based on the most recent Mortgage that was taken out on this home.
Original Mortgage
$108,400
Interest Rate
7.63%
Mortgage Type
Balloon
Purchase Details
Closed on
Mar 15, 1995
Sold by
Numrich Patricia D
Bought by
Morrow Dustin and Morrow Laurie
Home Financials for this Owner
Home Financials are based on the most recent Mortgage that was taken out on this home.
Original Mortgage
$127,247
Interest Rate
9.03%
Mortgage Type
FHA
Create a Home Valuation Report for This Property
The Home Valuation Report is an in-depth analysis detailing your home's value as well as a comparison with similar homes in the area
Home Values in the Area
Average Home Value in this Area
Purchase History
| Date | Buyer | Sale Price | Title Company |
|---|---|---|---|
| Ant Ventures Llc | -- | None Available | |
| Ant Ventures Llc | -- | None Available | |
| S Lawrences Grahams Ferry Llc | $100,000 | Fatco | |
| Taylor Teresa Ann | $153,400 | Fidelity National Title Co | |
| Morrow Dustin | $128,500 | First American Title Ins Co |
Source: Public Records
Mortgage History
| Date | Status | Borrower | Loan Amount |
|---|---|---|---|
| Previous Owner | Taylor Teresa Ann | $108,400 | |
| Previous Owner | Morrow Dustin | $127,247 |
Source: Public Records
Tax History Compared to Growth
Tax History
| Year | Tax Paid | Tax Assessment Tax Assessment Total Assessment is a certain percentage of the fair market value that is determined by local assessors to be the total taxable value of land and additions on the property. | Land | Improvement |
|---|---|---|---|---|
| 2025 | $4,506 | $234,612 | -- | -- |
| 2024 | $4,385 | $227,779 | -- | -- |
| 2023 | $4,385 | $221,145 | $0 | $0 |
| 2022 | $4,130 | $214,704 | $0 | $0 |
| 2021 | $3,815 | $208,451 | $0 | $0 |
| 2020 | $3,719 | $202,380 | $0 | $0 |
| 2019 | $3,627 | $196,486 | $0 | $0 |
| 2018 | $3,450 | $190,763 | $0 | $0 |
| 2017 | $3,329 | $185,207 | $0 | $0 |
| 2016 | $3,030 | $179,813 | $0 | $0 |
| 2015 | $2,928 | $174,576 | $0 | $0 |
| 2014 | $2,890 | $169,491 | $0 | $0 |
Source: Public Records
Map
Nearby Homes
- 5225 Jean Rd Unit 307
- 17401 Hill Way
- 4971 Lakeview Blvd
- 17239 Rebecca Ln
- 5189 Rosewood St
- 5328 Lower Dr
- 5513 Rachel Ln
- 5650 Lakeview Blvd
- 4280 Bernard St
- 4224 Haven St
- 4241 Cobb Way
- 5966 Frost Ln
- 4470 Lakeview Blvd
- 4264 Westbay Rd
- 16960 Denney Ct
- 17810 Sarah Hill Ln
- 18434 Sandpiper Cir
- 18581 Timbergrove Ct
- 5057 W Sunset Dr
- 16508 Bonaire Ave
- 17541 Deemar Way
- 17579 Deemar Way
- 5174 Lakeview Blvd
- 5172 Lakeview Blvd
- 17552 Deemar Way
- 17595 Deemar Way
- 17533 Mardee Ave
- 17646 Sydni Ct
- 17533 SW Mardee
- 17651 Deemar Way
- 17505 Mardee Ave
- 17635 Deemar Way
- 5170 Lakeview Blvd
- 17644 Sydni Ct
- 5172 Lakeview Bl
- 5172 Rd
- 17650 Deemar Way
- 17650 Deemar
- 5225 Jean Rd (3 15 Bac) Unit 403
- 17622 Sydni Ct