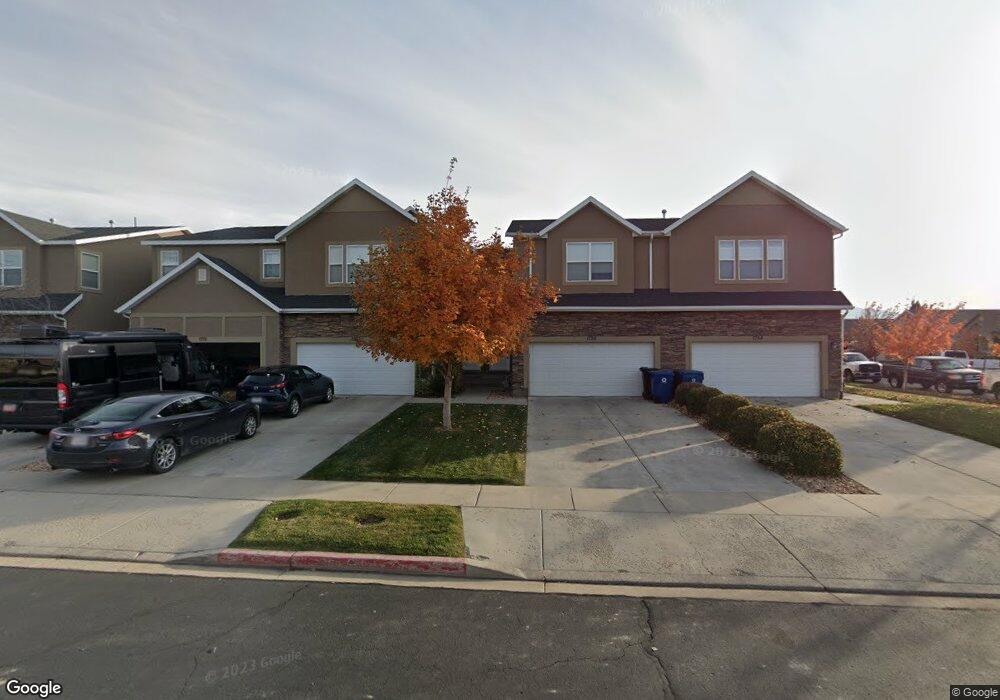
1756 E 920 S Spanish Fork, UT 84660
Estimated Value: $384,955 - $407,000
3
Beds
2
Baths
2,152
Sq Ft
$185/Sq Ft
Est. Value
About This Home
This home is located at 1756 E 920 S, Spanish Fork, UT 84660 and is currently estimated at $398,985, approximately $185 per square foot. 1756 E 920 S is a home located in Utah County with nearby schools including East Meadows Elementary School, Spanish Fork Jr High School, and Spanish Fork High School.
Ownership History
Date
Name
Owned For
Owner Type
Purchase Details
Closed on
Nov 21, 2019
Sold by
Dye Kristopher Kyle and Dye Michelle Elise
Bought by
Nielson Levi and Nielson Jessie
Current Estimated Value
Purchase Details
Closed on
Jul 1, 2013
Sold by
Dye Kristopher K
Bought by
Dye Kristopher Kyle and Dye Michelle Elise
Purchase Details
Closed on
Mar 29, 2006
Sold by
D R Horton Inc
Bought by
Dye Kristopher K
Home Financials for this Owner
Home Financials are based on the most recent Mortgage that was taken out on this home.
Original Mortgage
$115,567
Interest Rate
6.25%
Mortgage Type
Fannie Mae Freddie Mac
Create a Home Valuation Report for This Property
The Home Valuation Report is an in-depth analysis detailing your home's value as well as a comparison with similar homes in the area
Home Values in the Area
Average Home Value in this Area
Purchase History
| Date | Buyer | Sale Price | Title Company |
|---|---|---|---|
| Nielson Levi | -- | Old Republic Title | |
| Dye Kristopher Kyle | -- | None Available | |
| Dye Kristopher K | -- | Provo Land Title Company |
Source: Public Records
Mortgage History
| Date | Status | Borrower | Loan Amount |
|---|---|---|---|
| Previous Owner | Dye Kristopher K | $115,567 |
Source: Public Records
Tax History
| Year | Tax Paid | Tax Assessment Tax Assessment Total Assessment is a certain percentage of the fair market value that is determined by local assessors to be the total taxable value of land and additions on the property. | Land | Improvement |
|---|---|---|---|---|
| 2025 | $1,941 | $201,190 | -- | -- |
| 2024 | $1,941 | $200,035 | $0 | $0 |
| 2023 | $1,927 | $198,825 | $0 | $0 |
| 2022 | $1,866 | $188,815 | $0 | $0 |
| 2021 | $1,594 | $258,100 | $38,700 | $219,400 |
| 2020 | $1,549 | $243,800 | $36,600 | $207,200 |
| 2019 | $1,359 | $225,000 | $29,300 | $195,700 |
| 2018 | $1,281 | $205,000 | $25,000 | $180,000 |
| 2017 | $1,174 | $101,035 | $0 | $0 |
| 2016 | $1,082 | $91,850 | $0 | $0 |
| 2015 | $951 | $79,750 | $0 | $0 |
| 2014 | $830 | $69,850 | $0 | $0 |
Source: Public Records
Map
Nearby Homes
- 938 S 1740 E
- 2308 E 850 South St Unit 10
- 1878 E 1050 S
- 1147 S 1660 E
- 2044 E 800 S
- 1166 S 1920 E
- 232 E 860 S Unit 158
- 762 S 1360 E
- 762 S 1360 E Unit 25
- 857 S 1300 E Unit 32
- 857 S 1300 E
- 815 S 1300 E Unit 34
- 789 S 1300 E
- 834 S 1300 #16gc E
- 816 S 1300 #15gc E
- 1658 Dover Dr
- 357 E 1460 S Unit 45
- 385 E 1460 S Unit 47
- 2342 E 830 S Unit 27
- 2342 E 830 S Unit 26
Your Personal Tour Guide
Ask me questions while you tour the home.