1756 Pine Gate Way White City, OR 97503
Estimated Value: $624,000 - $2,883,383
2
Beds
3
Baths
1,744
Sq Ft
$1,006/Sq Ft
Est. Value
About This Home
This home is located at 1756 Pine Gate Way, White City, OR 97503 and is currently estimated at $1,753,692, approximately $1,005 per square foot. 1756 Pine Gate Way is a home located in Jackson County with nearby schools including Sams Valley Elementary School and Crater High School.
Ownership History
Date
Name
Owned For
Owner Type
Purchase Details
Closed on
Jun 2, 2017
Sold by
Grosslight Carolyn M
Bought by
Grosslight Carolyn M and Grosslight Family Trust
Current Estimated Value
Purchase Details
Closed on
Nov 8, 2010
Sold by
White Janna
Bought by
Grosslight Peter L and Grosslight Carolyn M
Purchase Details
Closed on
Jun 23, 2005
Sold by
White Gary
Bought by
White Janna
Purchase Details
Closed on
May 31, 2002
Sold by
Wright Colette Noel and Bennett Kathleen
Bought by
White Gary A and White Janna S
Home Financials for this Owner
Home Financials are based on the most recent Mortgage that was taken out on this home.
Original Mortgage
$100,000
Interest Rate
6.83%
Mortgage Type
Seller Take Back
Purchase Details
Closed on
Dec 11, 2000
Sold by
Wright Allan L and Estate Of Joan Fitch Combs
Bought by
Combs Cecil Michael and Bennett Kathleen
Create a Home Valuation Report for This Property
The Home Valuation Report is an in-depth analysis detailing your home's value as well as a comparison with similar homes in the area
Home Values in the Area
Average Home Value in this Area
Purchase History
| Date | Buyer | Sale Price | Title Company |
|---|---|---|---|
| Grosslight Carolyn M | -- | None Available | |
| Grosslight Peter L | $750,000 | Ticor Title Company Oregon | |
| White Janna | -- | -- | |
| White Gary A | $430,000 | First American Title Ins Co | |
| Combs Cecil Michael | -- | -- |
Source: Public Records
Mortgage History
| Date | Status | Borrower | Loan Amount |
|---|---|---|---|
| Previous Owner | White Gary A | $100,000 |
Source: Public Records
Tax History Compared to Growth
Tax History
| Year | Tax Paid | Tax Assessment Tax Assessment Total Assessment is a certain percentage of the fair market value that is determined by local assessors to be the total taxable value of land and additions on the property. | Land | Improvement |
|---|---|---|---|---|
| 2025 | $24,986 | $2,081,410 | $415,040 | $1,666,370 |
| 2024 | $24,986 | $2,020,790 | $402,950 | $1,617,840 |
| 2023 | $24,155 | $1,961,940 | $391,210 | $1,570,730 |
| 2022 | $23,642 | $1,961,940 | $391,210 | $1,570,730 |
| 2021 | $22,972 | $1,904,800 | $379,810 | $1,524,990 |
| 2020 | $22,303 | $1,849,330 | $368,750 | $1,480,580 |
| 2019 | $21,793 | $1,743,180 | $347,580 | $1,395,600 |
| 2018 | $21,118 | $1,692,410 | $337,460 | $1,354,950 |
| 2017 | $20,622 | $1,692,410 | $337,460 | $1,354,950 |
| 2016 | $20,021 | $1,595,270 | $318,100 | $1,277,170 |
| 2015 | $19,288 | $1,595,270 | $318,100 | $1,277,170 |
| 2014 | $18,278 | $1,503,700 | $299,830 | $1,203,870 |
Source: Public Records
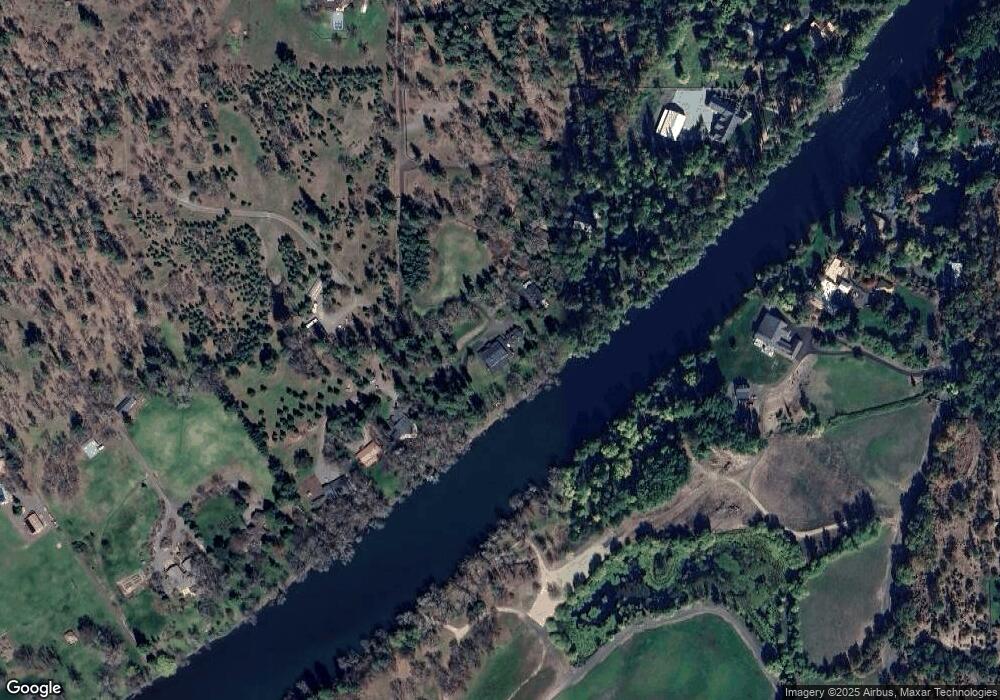
Map
Nearby Homes
- 700 Rogue Wood Dr
- 12240 Modoc Rd Unit A
- 12240 Modoc Rd Unit B
- 12240 Modoc Rd Unit C
- 12214 Modoc Rd
- 1000 Juliet St
- 12990 Modoc Rd
- 1374 W Linn Rd
- 13334 Modoc Rd
- 1100 W Rolling Hills Dr
- 1560 Brentwood Dr
- 739 W Rolling Hills Dr
- 14145 Agate Rd
- 180 Glass Ln
- 3659 Highway 234
- 407 N Deanjou Ave
- 403 N Deanjou Ave
- 507 Sienna Hills Dr
- 912 Stonewater Dr
- 179 N Deanjou Ave
- 900 Rogue Wood Dr
- 1738 Pine Gate Way
- 950 Rogue Wood Dr
- 12075 Agate Rd
- 12125 Agate Rd
- 820 Rogue Wood Dr
- 1420 Pine Gate Way
- 12155 Agate Rd
- 1660 Pine Gate Way
- 12271 Agate Rd
- 1670 Pine Gate Way
- 760 Rogue Wood Dr
- 1666 Pine Gate Way
- 11985 Agate Rd
- 11975 Agate Rd
- 1700 Pine Gate Way
- 1654 Pine Gate Way
- 1742 Pine Gate Way
- 12065 Agate Rd
- 12240 Modoc Rd