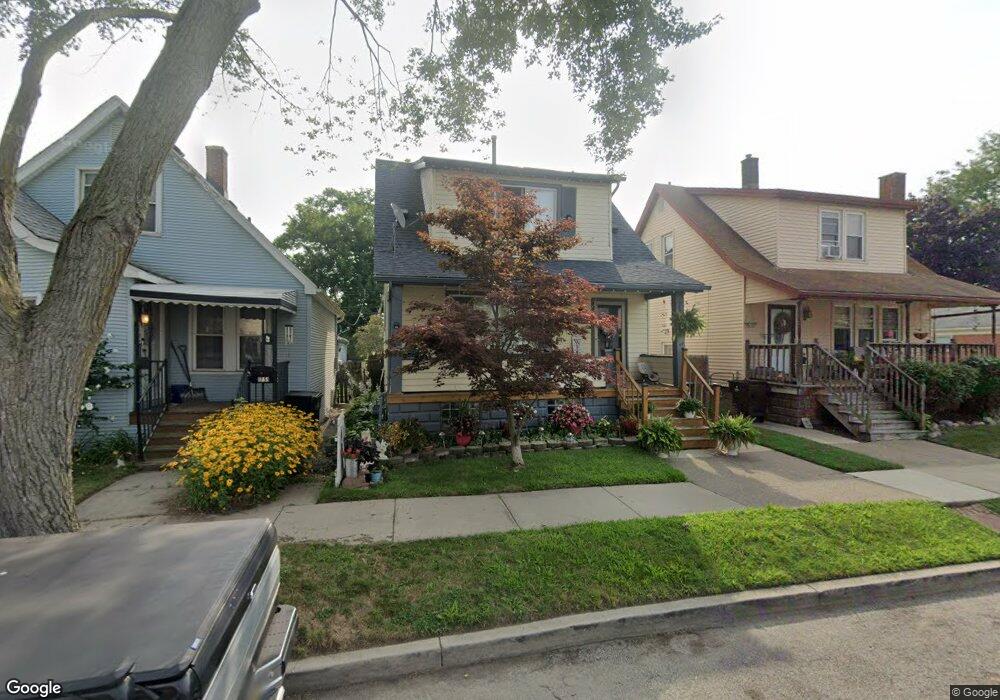
1757 7th St Wyandotte, MI 48192
Estimated Value: $153,000 - $188,000
--
Bed
--
Bath
1,078
Sq Ft
$153/Sq Ft
Est. Value
About This Home
This home is located at 1757 7th St, Wyandotte, MI 48192 and is currently estimated at $164,599, approximately $152 per square foot. 1757 7th St is a home located in Wayne County with nearby schools including Jefferson Elementary School, Woodrow Wilson School, and Roosevelt High School.
Ownership History
Date
Name
Owned For
Owner Type
Purchase Details
Closed on
Feb 26, 2003
Sold by
Zarasua Isaac P and Zarasua Gloria R
Bought by
Zarasua Jonathon Aaron
Current Estimated Value
Home Financials for this Owner
Home Financials are based on the most recent Mortgage that was taken out on this home.
Original Mortgage
$50,000
Interest Rate
5.86%
Mortgage Type
Purchase Money Mortgage
Purchase Details
Closed on
Apr 7, 1995
Sold by
Charles M Lee
Bought by
Charles M Lee
Create a Home Valuation Report for This Property
The Home Valuation Report is an in-depth analysis detailing your home's value as well as a comparison with similar homes in the area
Home Values in the Area
Average Home Value in this Area
Purchase History
| Date | Buyer | Sale Price | Title Company |
|---|---|---|---|
| Zarasua Jonathon Aaron | -- | Chirco Title Company | |
| Zarasua Jonathon Aaron | -- | -- | |
| Charles M Lee | $54,000 | -- |
Source: Public Records
Mortgage History
| Date | Status | Borrower | Loan Amount |
|---|---|---|---|
| Closed | Zarasua Jonathon Aaron | $50,000 |
Source: Public Records
Tax History Compared to Growth
Tax History
| Year | Tax Paid | Tax Assessment Tax Assessment Total Assessment is a certain percentage of the fair market value that is determined by local assessors to be the total taxable value of land and additions on the property. | Land | Improvement |
|---|---|---|---|---|
| 2025 | $1,326 | $75,900 | $0 | $0 |
| 2024 | $1,326 | $70,100 | $0 | $0 |
| 2023 | $1,264 | $63,800 | $0 | $0 |
| 2022 | $1,465 | $56,500 | $0 | $0 |
| 2021 | $1,435 | $50,400 | $0 | $0 |
| 2020 | $1,416 | $45,200 | $0 | $0 |
| 2019 | $1,396 | $41,600 | $0 | $0 |
| 2018 | $1,114 | $30,100 | $0 | $0 |
| 2017 | $488 | $30,100 | $0 | $0 |
| 2016 | $1,348 | $27,400 | $0 | $0 |
| 2015 | $2,405 | $25,400 | $0 | $0 |
| 2013 | $2,330 | $23,300 | $0 | $0 |
| 2012 | $1,100 | $24,400 | $3,600 | $20,800 |
Source: Public Records
Map
Nearby Homes