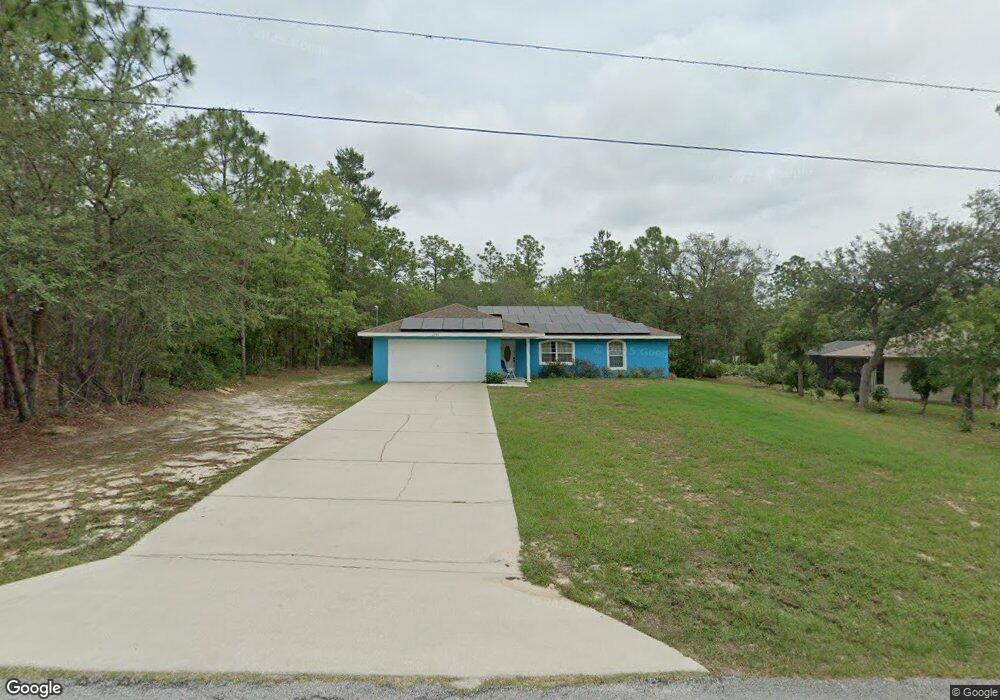
1757 E Bismark St Hernando, FL 34442
Estimated Value: $231,000 - $308,000
3
Beds
2
Baths
1,365
Sq Ft
$205/Sq Ft
Est. Value
About This Home
This home is located at 1757 E Bismark St, Hernando, FL 34442 and is currently estimated at $280,196, approximately $205 per square foot. 1757 E Bismark St is a home located in Citrus County with nearby schools including Hernando Elementary School, Citrus Springs Middle School, and Lecanto High School.
Ownership History
Date
Name
Owned For
Owner Type
Purchase Details
Closed on
Jun 28, 2002
Sold by
Moriah Development Inc
Bought by
Hale Mark A and Hale Janice M
Current Estimated Value
Home Financials for this Owner
Home Financials are based on the most recent Mortgage that was taken out on this home.
Original Mortgage
$101,350
Outstanding Balance
$42,792
Interest Rate
6.79%
Mortgage Type
VA
Estimated Equity
$237,404
Purchase Details
Closed on
Aug 11, 2001
Sold by
Fahey John T and Fahey Jacquelyne
Bought by
Moriah Development Inc
Purchase Details
Closed on
May 1, 1996
Bought by
Hale Mark A and Hale Janice M
Purchase Details
Closed on
Dec 1, 1978
Bought by
Hale Mark A and Hale Janice M
Purchase Details
Closed on
Mar 1, 1978
Bought by
Hale Mark A and Hale Janice M
Create a Home Valuation Report for This Property
The Home Valuation Report is an in-depth analysis detailing your home's value as well as a comparison with similar homes in the area
Home Values in the Area
Average Home Value in this Area
Purchase History
| Date | Buyer | Sale Price | Title Company |
|---|---|---|---|
| Hale Mark A | $99,400 | Crystal River Title | |
| Moriah Development Inc | $6,500 | Crystal River Title | |
| Hale Mark A | $15,200 | -- | |
| Hale Mark A | $34,300 | -- | |
| Hale Mark A | $70,000 | -- |
Source: Public Records
Mortgage History
| Date | Status | Borrower | Loan Amount |
|---|---|---|---|
| Open | Hale Mark A | $101,350 |
Source: Public Records
Tax History
| Year | Tax Paid | Tax Assessment Tax Assessment Total Assessment is a certain percentage of the fair market value that is determined by local assessors to be the total taxable value of land and additions on the property. | Land | Improvement |
|---|---|---|---|---|
| 2025 | $1,068 | $109,976 | -- | -- |
| 2024 | $1,031 | $106,877 | -- | -- |
| 2023 | $1,031 | $103,764 | $0 | $0 |
| 2022 | $963 | $100,742 | $0 | $0 |
| 2021 | $921 | $97,808 | $0 | $0 |
| 2020 | $855 | $139,335 | $12,700 | $126,635 |
| 2019 | $836 | $131,251 | $13,100 | $118,151 |
| 2018 | $803 | $123,313 | $12,000 | $111,313 |
| 2017 | $793 | $90,628 | $8,300 | $82,328 |
| 2016 | $834 | $91,261 | $8,570 | $82,691 |
| 2015 | $840 | $90,627 | $7,140 | $83,487 |
| 2014 | $851 | $89,908 | $8,555 | $81,353 |
Source: Public Records
Map
Nearby Homes
- 1724 E Mckinley St
- 3157 N Hamlin Terrace
- 1576 E Cleveland St
- 1405 E Amberjack Dr
- 1670 E Amberjack Dr
- 1142 E Bismark St
- 1716 E Bismark St
- 1011 E Bismark St
- 1401 E Bismark St
- 1012 & 1030 E Mckinley St
- 1155 E Bismark St
- 1139 E Mckinley St
- 3401 N Bonnie Point
- 2180 & 2152 N Page Ave
- 1255 E Rockefeller Ln
- 2409 N Fatima Ave
- 3125 N Canterbury Lake Dr
- 2719 N Crossbow Point
- 2540 E Loma Ct
- 1264 E Getty Ln
- 1779 E Bismark St
- 1721 E Bismark St
- 2810 N Hamlin Terrace
- 2840 N Hamlin Terrace
- 1703 E Bismark St
- 1768 E Bismark St
- 1744 E Bismark St
- 1814 E Bismark St
- 1691 E Bismark St
- 1667 E Bismark St
- 1674 E Bismark St
- 1858 E Bismark St
- 1780 E Mckinley St
- 2889 N Hamlin Terrace
- 1656 E Bismark St
- 1651 E Bismark St
- 2867 N Hamlin Terrace
- 2965 N Hamlin Terrace
- 2921 N Hamlin Terrace
- 0 N Hamlin Terrace
Your Personal Tour Guide
Ask me questions while you tour the home.