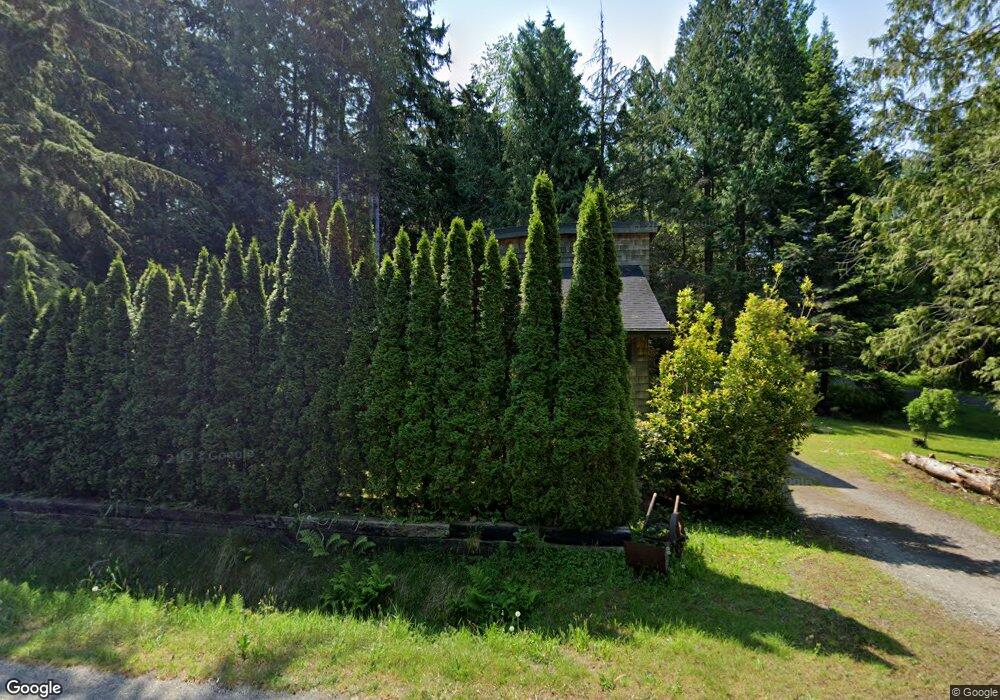
1757 Johnson Rd Point Roberts, WA 98281
Estimated Value: $361,000 - $496,000
2
Beds
2
Baths
1,456
Sq Ft
$284/Sq Ft
Est. Value
About This Home
This home is located at 1757 Johnson Rd, Point Roberts, WA 98281 and is currently estimated at $413,218, approximately $283 per square foot. 1757 Johnson Rd is a home located in Whatcom County with nearby schools including Point Roberts Primary School, Blaine Middle School, and Blaine High School.
Ownership History
Date
Name
Owned For
Owner Type
Purchase Details
Closed on
Aug 4, 2009
Sold by
Calder Kenneth John
Bought by
Calder Jennifer Wilson
Current Estimated Value
Purchase Details
Closed on
Aug 17, 2001
Sold by
Parker William Hudson
Bought by
Calder Kenneth J and Blyth Calder Jennifer W
Home Financials for this Owner
Home Financials are based on the most recent Mortgage that was taken out on this home.
Original Mortgage
$35,000
Interest Rate
7.09%
Purchase Details
Closed on
Aug 9, 2001
Sold by
Va
Bought by
Hansen Clemetis G
Home Financials for this Owner
Home Financials are based on the most recent Mortgage that was taken out on this home.
Original Mortgage
$35,000
Interest Rate
7.09%
Create a Home Valuation Report for This Property
The Home Valuation Report is an in-depth analysis detailing your home's value as well as a comparison with similar homes in the area
Home Values in the Area
Average Home Value in this Area
Purchase History
| Date | Buyer | Sale Price | Title Company |
|---|---|---|---|
| Calder Jennifer Wilson | -- | None Available | |
| Calder Kenneth J | -- | Chicago Title Insurance | |
| Hansen Clemetis G | -- | Chicago Title Insurance |
Source: Public Records
Mortgage History
| Date | Status | Borrower | Loan Amount |
|---|---|---|---|
| Previous Owner | Calder Kenneth J | $35,000 |
Source: Public Records
Tax History
| Year | Tax Paid | Tax Assessment Tax Assessment Total Assessment is a certain percentage of the fair market value that is determined by local assessors to be the total taxable value of land and additions on the property. | Land | Improvement |
|---|---|---|---|---|
| 2025 | $927 | $339,535 | $133,815 | $205,720 |
| 2024 | $2,720 | $336,169 | $132,495 | $203,674 |
| 2023 | $2,720 | $324,124 | $120,450 | $203,674 |
| 2022 | $2,018 | $296,004 | $110,000 | $130,290 |
| 2021 | $2,010 | $195,832 | $65,542 | $130,290 |
| 2020 | $2,003 | $181,324 | $60,687 | $120,637 |
| 2019 | $1,862 | $173,930 | $58,212 | $115,718 |
| 2018 | $1,725 | $156,362 | $52,332 | $104,030 |
| 2017 | $1,497 | $149,334 | $49,980 | $99,354 |
| 2016 | $1,517 | $146,406 | $49,000 | $97,406 |
| 2015 | $1,613 | $144,332 | $48,305 | $96,027 |
| 2014 | -- | $150,888 | $50,500 | $100,388 |
| 2013 | -- | $144,297 | $48,500 | $95,797 |
Source: Public Records
Map
Nearby Homes
- 245 Shady Glen Ave
- 1 Mill Rd
- 2 Mill Rd
- 1871 Johnson Rd
- 125 Park Dr
- 157 Northwood Dr
- 1774 Centennial Place
- 1928 Sanders Ct Unit 2
- 25 Roosevelt Way
- 168 Tyee Dr
- 0 Tyee Dr
- 1542 Columbia Vista Dr
- 0 15 Whalen Dr
- 19 Whalen Dr
- 1427 Mckenzie Way
- 230 Iris Blvd
- 0 3 73 Acres Derby Ave
- 11 Lot Rex St
- 2138 Benson Rd
- 0 Deer Rd
- 205 Shady Glen Ave
- 219 Shady Glen Ave
- 226 James Rd
- 224 Windsor Dr
- Lot 77 James Rd
- 228 James Rd
- 235 Shady Glen Ave
- 245 Windsor Dr
- 223 Mill Rd
- 240 Windsor Dr
- 256 Shady Glen Lot 30-32 Ave
- 256 Shady Glen Ave
- 244 James Rd
- 249 Windsor Dr
- 41 Shady Glen Ave
- 0 Lot 41 Shady Glen Ave
- Lot 36 Shady Glen Ave
- 253 Shady Glen Ave
- 196 Mill Rd
- 245 Mill Rd
Your Personal Tour Guide
Ask me questions while you tour the home.