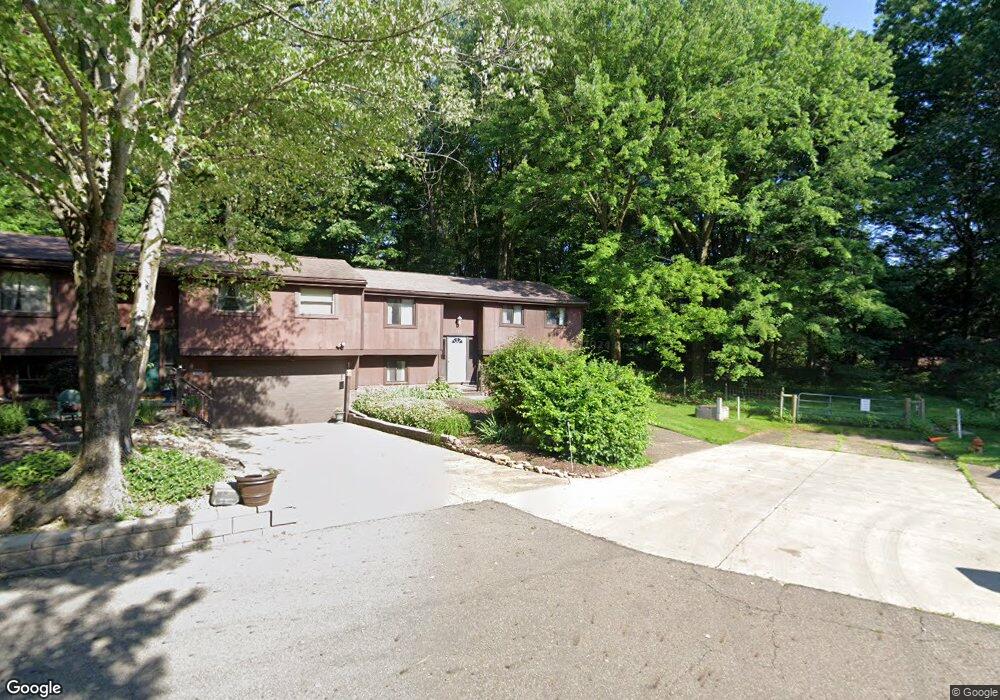
1757 Oak Trail St NE Unit 1Y Massillon, OH 44646
Amherst Heights-Clearview NeighborhoodEstimated Value: $126,112 - $171,000
2
Beds
1
Bath
828
Sq Ft
$180/Sq Ft
Est. Value
About This Home
This home is located at 1757 Oak Trail St NE Unit 1Y, Massillon, OH 44646 and is currently estimated at $149,028, approximately $179 per square foot. 1757 Oak Trail St NE Unit 1Y is a home located in Stark County with nearby schools including Massillon Intermediate School, Massillon Junior High School, and Washington High School.
Ownership History
Date
Name
Owned For
Owner Type
Purchase Details
Closed on
Sep 19, 2006
Sold by
Knight Michael A and Knight Jacquelyn
Bought by
Bucey Mary
Current Estimated Value
Home Financials for this Owner
Home Financials are based on the most recent Mortgage that was taken out on this home.
Original Mortgage
$90,725
Interest Rate
6.29%
Mortgage Type
Purchase Money Mortgage
Purchase Details
Closed on
Mar 31, 2006
Sold by
Herdman Penelope D
Bought by
Knight Michael A
Purchase Details
Closed on
Apr 9, 1997
Sold by
Emsweller Kenneth F
Bought by
Herdman William H and Herdman Penelope D
Home Financials for this Owner
Home Financials are based on the most recent Mortgage that was taken out on this home.
Original Mortgage
$69,850
Interest Rate
7.74%
Mortgage Type
FHA
Purchase Details
Closed on
Jul 18, 1994
Sold by
Drake Mary D
Bought by
Emsweller Kenneth F
Home Financials for this Owner
Home Financials are based on the most recent Mortgage that was taken out on this home.
Original Mortgage
$46,400
Interest Rate
8.6%
Mortgage Type
New Conventional
Create a Home Valuation Report for This Property
The Home Valuation Report is an in-depth analysis detailing your home's value as well as a comparison with similar homes in the area
Home Values in the Area
Average Home Value in this Area
Purchase History
| Date | Buyer | Sale Price | Title Company |
|---|---|---|---|
| Bucey Mary | $95,500 | None Available | |
| Knight Michael A | $66,000 | None Available | |
| Herdman William H | $71,500 | -- | |
| Emsweller Kenneth F | $58,000 | -- |
Source: Public Records
Mortgage History
| Date | Status | Borrower | Loan Amount |
|---|---|---|---|
| Closed | Bucey Mary | $90,725 | |
| Previous Owner | Herdman William H | $69,850 | |
| Previous Owner | Emsweller Kenneth F | $46,400 |
Source: Public Records
Tax History Compared to Growth
Tax History
| Year | Tax Paid | Tax Assessment Tax Assessment Total Assessment is a certain percentage of the fair market value that is determined by local assessors to be the total taxable value of land and additions on the property. | Land | Improvement |
|---|---|---|---|---|
| 2025 | -- | $37,590 | $8,470 | $29,120 |
| 2024 | -- | $37,590 | $8,470 | $29,120 |
| 2023 | $1,043 | $29,550 | $6,410 | $23,140 |
| 2022 | $534 | $29,550 | $6,410 | $23,140 |
| 2021 | $1,086 | $29,550 | $6,410 | $23,140 |
| 2020 | $913 | $25,310 | $5,110 | $20,200 |
| 2019 | $906 | $25,310 | $5,110 | $20,200 |
| 2018 | $901 | $25,310 | $5,110 | $20,200 |
| 2017 | $863 | $23,560 | $5,180 | $18,380 |
| 2016 | $877 | $23,560 | $5,180 | $18,380 |
| 2015 | $866 | $23,560 | $5,180 | $18,380 |
| 2014 | $738 | $20,930 | $5,390 | $15,540 |
| 2013 | $373 | $20,930 | $5,390 | $15,540 |
Source: Public Records
Map
Nearby Homes
- 1744 Oak Trail St NE
- 2107 Via Luna Cir NE
- Caicos Plan at Tuscany Park
- 2919 Inwood Dr NW
- 1717 Chittenden Cir NE
- 1312 Lennox Ave NE
- 7770 Hills And Dales Rd NW
- 0 Wildridge Rd NW Unit 36853475
- 2406 Nottingham St NW
- 2433 Fontana St NW
- 1209 Providence Rd NE
- 2554 Mary Lou St NW
- 1026 Beverly Rd NE
- 1204 Taggart St NW
- 1267 Plymouth St NW
- 860 Franklin Rd NE
- 1935 Stoner Ave NE
- 2730 Boron St NW
- 1706 Jefferson Rd NE
- 860 Milburn Rd NE
- 1755 Oak Trail St NE
- 1802 Lake Trail NE
- 1756 Oak Trail St NE
- 1753 Oak Trail St NE Unit 1X
- 1751 Oak Trail St NE
- 1754 Oak Trail St NE Unit 1T
- 1804 Lake Trail NE
- 1805 Lake Trail NE
- 1752 Oak Trail St NE Unit 1S
- 1807 Lake Trail NE
- 1749 Oak Trail St NE
- 1750 Oak Trail St NE
- 1750 Oak Trail St NE Unit 1R
- 1415 Valerie Ave NE
- 1745 Oak Trail St NE Unit 1O
- 1748 Oak Trail St NE Unit 1Q
- 1746 Oak Trail St NE
- 1743 Oak Trail St NE
- 1742 Oak Trail St NE
- 1741 Oak Trail St NE