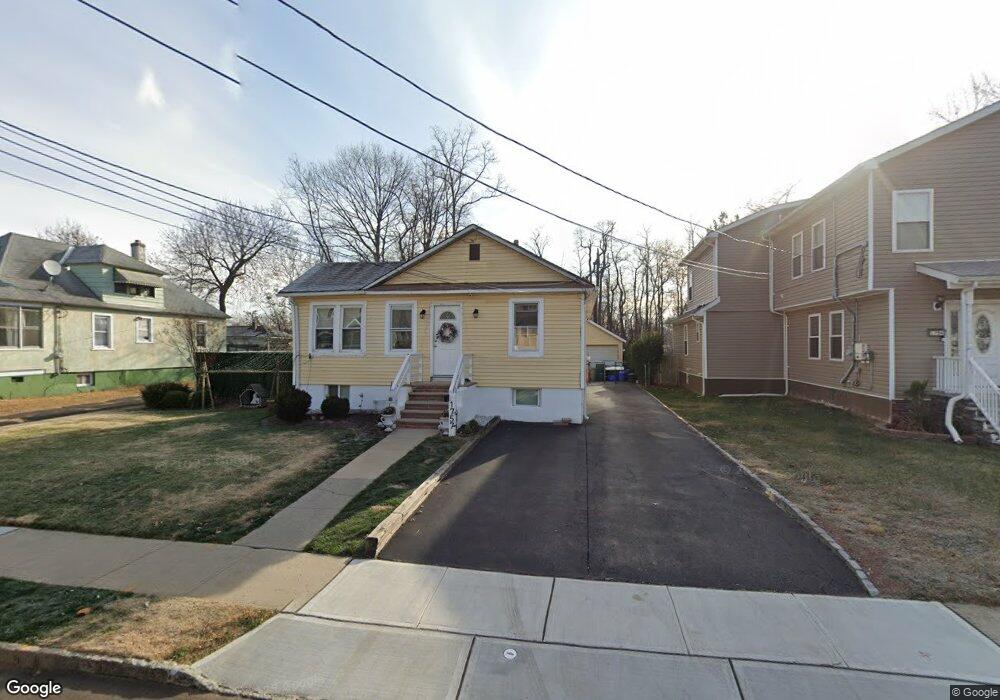
1757 W 5th St Piscataway, NJ 08854
Estimated Value: $368,000 - $471,000
2
Beds
2
Baths
1,000
Sq Ft
$427/Sq Ft
Est. Value
About This Home
This home is located at 1757 W 5th St, Piscataway, NJ 08854 and is currently estimated at $427,414, approximately $427 per square foot. 1757 W 5th St is a home located in Middlesex County with nearby schools including Arbor Intermediate School, Dwight D. Eisenhower School, and Quibbletown Middle School.
Ownership History
Date
Name
Owned For
Owner Type
Purchase Details
Closed on
Aug 10, 2006
Sold by
Valentinuzzi Lisa
Bought by
Castro Abraham and Castro Reina
Current Estimated Value
Home Financials for this Owner
Home Financials are based on the most recent Mortgage that was taken out on this home.
Original Mortgage
$212,400
Outstanding Balance
$127,799
Interest Rate
6.8%
Estimated Equity
$299,615
Purchase Details
Closed on
Jul 22, 2002
Sold by
Howell Larry
Bought by
Valentinuzzi Lisa
Home Financials for this Owner
Home Financials are based on the most recent Mortgage that was taken out on this home.
Original Mortgage
$150,005
Interest Rate
6.25%
Create a Home Valuation Report for This Property
The Home Valuation Report is an in-depth analysis detailing your home's value as well as a comparison with similar homes in the area
Home Values in the Area
Average Home Value in this Area
Purchase History
| Date | Buyer | Sale Price | Title Company |
|---|---|---|---|
| Castro Abraham | $265,500 | -- | |
| Valentinuzzi Lisa | $157,900 | -- |
Source: Public Records
Mortgage History
| Date | Status | Borrower | Loan Amount |
|---|---|---|---|
| Open | Castro Abraham | $212,400 | |
| Previous Owner | Valentinuzzi Lisa | $150,005 |
Source: Public Records
Tax History Compared to Growth
Tax History
| Year | Tax Paid | Tax Assessment Tax Assessment Total Assessment is a certain percentage of the fair market value that is determined by local assessors to be the total taxable value of land and additions on the property. | Land | Improvement |
|---|---|---|---|---|
| 2025 | $5,181 | $332,200 | $232,500 | $99,700 |
| 2024 | $5,355 | $265,300 | $150,000 | $115,300 |
| 2023 | $5,355 | $256,200 | $150,000 | $106,200 |
| 2022 | $5,427 | $241,100 | $150,000 | $91,100 |
| 2021 | $4,799 | $231,500 | $150,000 | $81,500 |
| 2020 | $5,796 | $248,100 | $120,000 | $128,100 |
| 2019 | $5,282 | $222,100 | $120,000 | $102,100 |
| 2018 | $5,135 | $216,100 | $120,000 | $96,100 |
| 2017 | $5,145 | $187,100 | $100,000 | $87,100 |
| 2016 | $5,046 | $187,100 | $100,000 | $87,100 |
| 2015 | $4,977 | $187,100 | $100,000 | $87,100 |
| 2014 | $4,865 | $187,100 | $100,000 | $87,100 |
Source: Public Records
Map
Nearby Homes
- 1718 W 4th St
- 1724 Quincy St
- 1825 Brunella Ave
- 1621 Albert St
- 1620 Quincy St
- 324 Rock Ave
- 1565 W 6th St
- 1433 Dogwood Dr
- 1866 W 7th St
- 304 Chestnut Place
- 1631 Brunella Ave
- 118 Jadach Dr
- 405 Wall St
- 203 Walnut St
- 233 Maple Ave
- 1515 Dogwood Dr
- 525 Pleasant Ave
- 1758 S 2nd St
- 1762 S 2nd St
- 203 S Washington Ave