17579 Frank Madla Rd Helotes, TX 78023
Cedar Creek NeighborhoodEstimated Value: $588,000 - $840,000
6
Beds
3
Baths
3,436
Sq Ft
$210/Sq Ft
Est. Value
About This Home
This home is located at 17579 Frank Madla Rd, Helotes, TX 78023 and is currently estimated at $722,085, approximately $210 per square foot. 17579 Frank Madla Rd is a home located in Bexar County with nearby schools including Los Reyes Elementary School, Garcia Middle School, and O'Connor High School.
Ownership History
Date
Name
Owned For
Owner Type
Purchase Details
Closed on
May 15, 2023
Sold by
Kinkler Linda Lou Gillespie
Bought by
Wingenter Kerry Kinkler
Current Estimated Value
Purchase Details
Closed on
Dec 2, 2022
Sold by
Kinkler E Sterling
Bought by
Kinkler Linda Lou Gillespi
Purchase Details
Closed on
Nov 29, 2017
Sold by
Birkner Katherine M
Bought by
Kinkler Ernest Sterling and Wingenter Ronald Carl
Purchase Details
Closed on
Dec 11, 2012
Sold by
Mora Jose Luis and Mora Patricia S
Bought by
Birkner Katherine M
Home Financials for this Owner
Home Financials are based on the most recent Mortgage that was taken out on this home.
Original Mortgage
$300,000
Interest Rate
3.37%
Mortgage Type
New Conventional
Create a Home Valuation Report for This Property
The Home Valuation Report is an in-depth analysis detailing your home's value as well as a comparison with similar homes in the area
Home Values in the Area
Average Home Value in this Area
Purchase History
| Date | Buyer | Sale Price | Title Company |
|---|---|---|---|
| Wingenter Kerry Kinkler | -- | None Listed On Document | |
| Kinkler Linda Lou Gillespi | -- | -- | |
| Kinkler Ernest Sterling | -- | None Available | |
| Birkner Katherine M | -- | First American Title |
Source: Public Records
Mortgage History
| Date | Status | Borrower | Loan Amount |
|---|---|---|---|
| Previous Owner | Birkner Katherine M | $300,000 |
Source: Public Records
Tax History Compared to Growth
Tax History
| Year | Tax Paid | Tax Assessment Tax Assessment Total Assessment is a certain percentage of the fair market value that is determined by local assessors to be the total taxable value of land and additions on the property. | Land | Improvement |
|---|---|---|---|---|
| 2025 | $9,465 | $655,054 | $183,320 | $520,810 |
| 2024 | $9,465 | $605,877 | $183,320 | $535,640 |
| 2023 | $9,465 | $563,621 | $183,320 | $563,830 |
| 2022 | $10,436 | $513,758 | $153,810 | $522,800 |
| 2021 | $9,382 | $445,640 | $96,410 | $349,230 |
| 2020 | $8,988 | $417,930 | $96,410 | $321,520 |
| 2019 | $9,371 | $422,000 | $96,410 | $325,590 |
| 2018 | $8,911 | $400,970 | $80,640 | $320,330 |
| 2017 | $8,283 | $371,910 | $80,640 | $291,270 |
| 2016 | $8,351 | $374,970 | $80,640 | $294,330 |
| 2015 | $7,561 | $377,460 | $79,630 | $297,830 |
| 2014 | $7,561 | $338,120 | $0 | $0 |
Source: Public Records
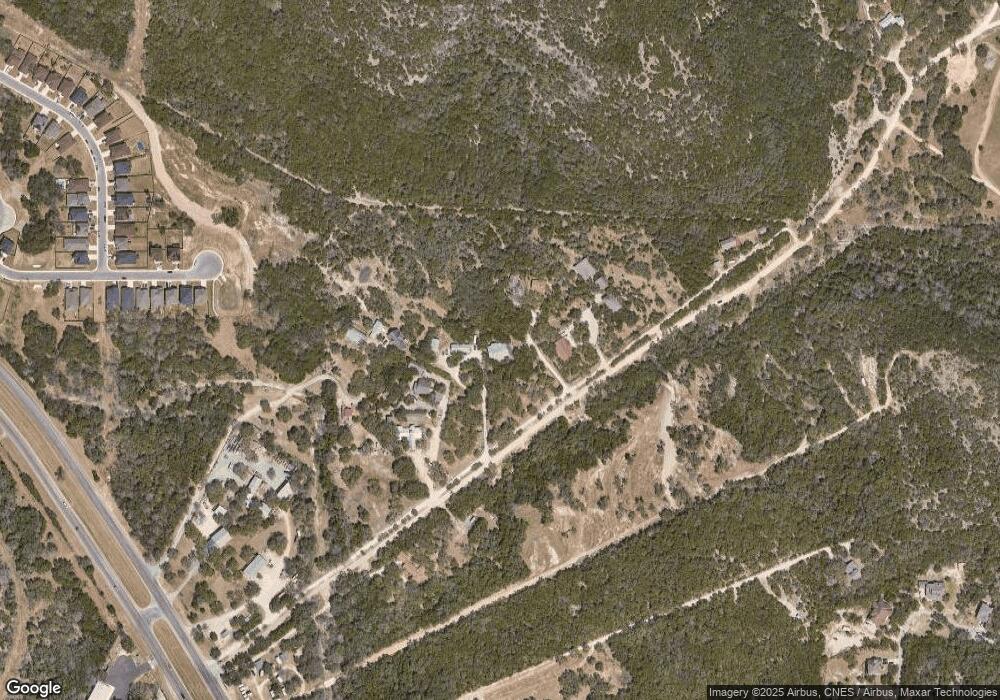
Map
Nearby Homes
- 17132 Bandera Rd
- 11224 Hill Top Bend
- 11312 Red Oak Turn
- 11243 Hill Top Loop
- 11314 Hill Top Bend
- 11330 Hill Top Bend
- 16812 Fox Ridge
- 11234 Condor Pass
- 10607 Carmona
- 10811 Newcroft Place
- 11407 Massive Mount
- 16523 Loma Landing
- 11228 Cave Creek
- 16827 Marlhead
- 11224 Cave Creek
- 10515 Cima Vista
- 11229 Cave Creek
- 11215 Indian Caves
- 17820 Oxford Mount
- 11418 Lago Vista
- 17617 Frank Madla Rd
- 17631 Frank Madla Rd
- 17240 Bandera Rd
- 17795 Frank Madla Rd
- 10954 Red Oak Turn
- 10958 Red Oak Turn
- 10962 Red Oak Turn
- 17430 Bandera Rd Unit 3
- 17430 Bandera Rd
- 10961 Red Oak Turn
- 10966 Red Oak Turn
- 10970 Red Oak Turn
- 10965 Red Oak Turn
- 10974 Red Oak Turn
- 11091 Hill Top Loop
- 11095 Hill Top Loop
- 11099 Hill Top Loop
- 11083 Hill Top Loop
- 11087 Hill Top Loop
- 10978 Red Oak Turn