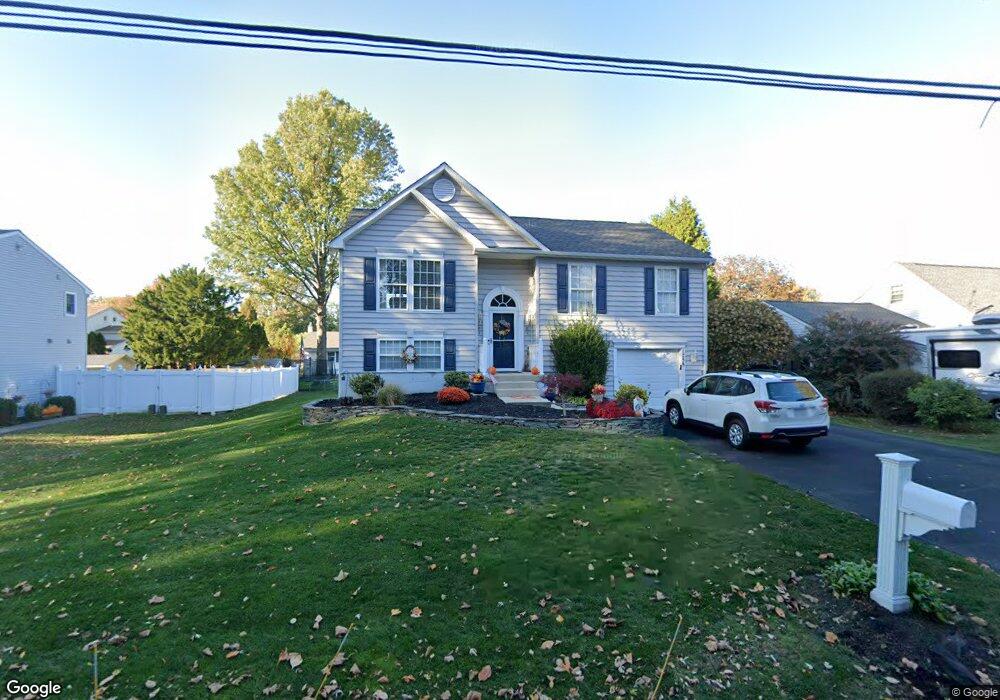
1758 3rd St Langhorne, PA 19047
Estimated Value: $385,000 - $451,000
2
Beds
1
Bath
1,108
Sq Ft
$378/Sq Ft
Est. Value
About This Home
This home is located at 1758 3rd St, Langhorne, PA 19047 and is currently estimated at $419,138, approximately $378 per square foot. 1758 3rd St is a home located in Bucks County with nearby schools including Pearl S. Buck Elementary School, Maple Point Middle School, and Neshaminy High School.
Ownership History
Date
Name
Owned For
Owner Type
Purchase Details
Closed on
Jan 25, 2017
Sold by
Curran Joan M
Bought by
Curran Kelly
Current Estimated Value
Home Financials for this Owner
Home Financials are based on the most recent Mortgage that was taken out on this home.
Original Mortgage
$94,000
Outstanding Balance
$78,045
Interest Rate
4.3%
Mortgage Type
New Conventional
Estimated Equity
$341,093
Purchase Details
Closed on
Feb 4, 1991
Bought by
Schuenemann Robert J Jr
Create a Home Valuation Report for This Property
The Home Valuation Report is an in-depth analysis detailing your home's value as well as a comparison with similar homes in the area
Home Values in the Area
Average Home Value in this Area
Purchase History
| Date | Buyer | Sale Price | Title Company |
|---|---|---|---|
| Curran Kelly | $117,500 | Title Services | |
| Schuenemann Robert J Jr | -- | -- |
Source: Public Records
Mortgage History
| Date | Status | Borrower | Loan Amount |
|---|---|---|---|
| Open | Curran Kelly | $94,000 |
Source: Public Records
Tax History
| Year | Tax Paid | Tax Assessment Tax Assessment Total Assessment is a certain percentage of the fair market value that is determined by local assessors to be the total taxable value of land and additions on the property. | Land | Improvement |
|---|---|---|---|---|
| 2025 | $5,059 | $23,240 | $4,200 | $19,040 |
| 2024 | $5,059 | $23,240 | $4,200 | $19,040 |
| 2023 | $4,979 | $23,240 | $4,200 | $19,040 |
| 2022 | $4,848 | $23,240 | $4,200 | $19,040 |
| 2021 | $4,848 | $23,240 | $4,200 | $19,040 |
| 2020 | $4,790 | $23,240 | $4,200 | $19,040 |
| 2019 | $4,683 | $23,240 | $4,200 | $19,040 |
| 2018 | $4,597 | $23,240 | $4,200 | $19,040 |
| 2017 | $4,480 | $23,240 | $4,200 | $19,040 |
| 2016 | $4,611 | $23,240 | $4,200 | $19,040 |
| 2015 | $4,669 | $23,240 | $4,200 | $19,040 |
| 2014 | $4,669 | $23,240 | $4,200 | $19,040 |
Source: Public Records
Map
Nearby Homes
- 1836 3rd St
- 627 Bellflower Rd Unit V260
- 67 Black Eyed Susan Rd
- 0000 Kyle Ln
- 01 Kyle Ln
- 000 Kyle Ln
- 1246 Saint James Dr Unit 46
- 623 Saint James Ct
- 43 Tweed Rd
- 311 Saint James Dr Unit 11
- 9 Honey Locust Rd
- 9 Harmony Rd
- 24114 Hickory Ln
- 46 Hydrangea Rd
- 169 Forsythia Dr N
- 0 Highland Ave E Unit PABU2111912
- 0 Highland Ave E Unit PABU2111920
- 20 Griffin Way
- 413 N Pine St
- 118 Blough Rd
Your Personal Tour Guide
Ask me questions while you tour the home.