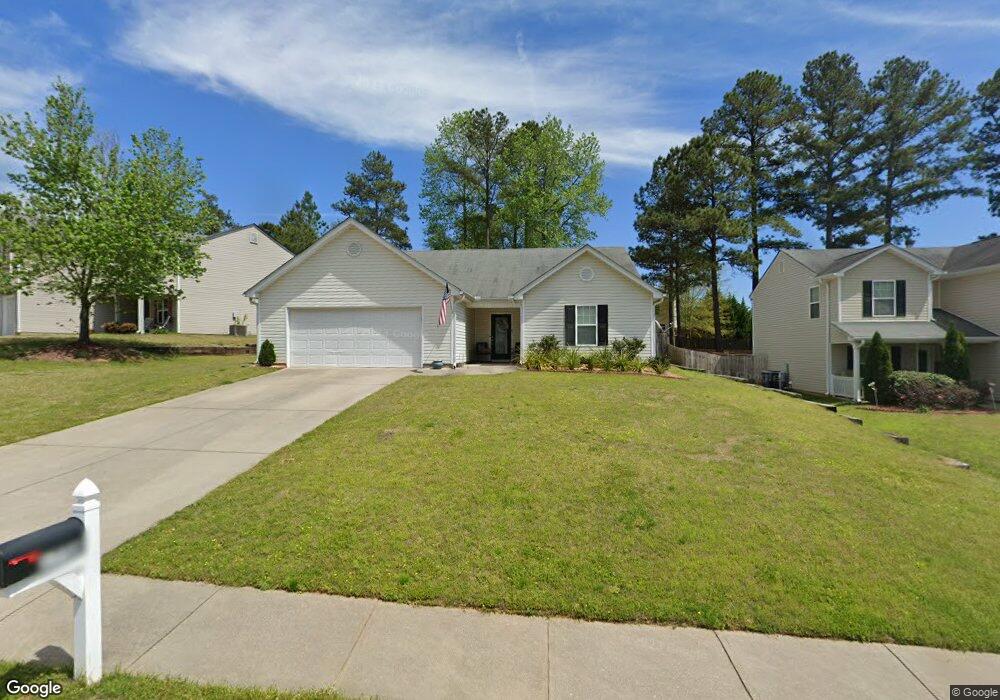
1758 Maxey Ln Unit 9 Winder, GA 30680
Estimated Value: $321,291 - $358,000
3
Beds
2
Baths
1,617
Sq Ft
$212/Sq Ft
Est. Value
About This Home
This home is located at 1758 Maxey Ln Unit 9, Winder, GA 30680 and is currently estimated at $343,073, approximately $212 per square foot. 1758 Maxey Ln Unit 9 is a home located in Barrow County with nearby schools including Yargo Elementary School, Haymon-Morris Middle School, and Apalachee High School.
Ownership History
Date
Name
Owned For
Owner Type
Purchase Details
Closed on
Dec 21, 2018
Sold by
Richardson Alec
Bought by
Cook Jamie R and Cook Matthew A
Current Estimated Value
Home Financials for this Owner
Home Financials are based on the most recent Mortgage that was taken out on this home.
Original Mortgage
$171,731
Outstanding Balance
$152,143
Interest Rate
5.37%
Mortgage Type
FHA
Estimated Equity
$190,930
Purchase Details
Closed on
Sep 17, 2008
Sold by
Jim Prewitt Builders Inc
Bought by
Richardson Alec
Home Financials for this Owner
Home Financials are based on the most recent Mortgage that was taken out on this home.
Original Mortgage
$142,051
Interest Rate
5.78%
Mortgage Type
FHA
Purchase Details
Closed on
Feb 8, 2008
Sold by
Sunrise Development Of Georgia
Bought by
Jim Prewitt Builders Llc
Purchase Details
Closed on
Aug 19, 2005
Bought by
Sunrise Development Of Georgia Llc
Create a Home Valuation Report for This Property
The Home Valuation Report is an in-depth analysis detailing your home's value as well as a comparison with similar homes in the area
Home Values in the Area
Average Home Value in this Area
Purchase History
| Date | Buyer | Sale Price | Title Company |
|---|---|---|---|
| Cook Jamie R | $174,900 | -- | |
| Richardson Alec | $144,700 | -- | |
| Jim Prewitt Builders Llc | $45,600 | -- | |
| Sunrise Development Of Georgia Llc | -- | -- |
Source: Public Records
Mortgage History
| Date | Status | Borrower | Loan Amount |
|---|---|---|---|
| Open | Cook Jamie R | $171,731 | |
| Previous Owner | Richardson Alec | $142,051 |
Source: Public Records
Tax History
| Year | Tax Paid | Tax Assessment Tax Assessment Total Assessment is a certain percentage of the fair market value that is determined by local assessors to be the total taxable value of land and additions on the property. | Land | Improvement |
|---|---|---|---|---|
| 2025 | $2,811 | $120,478 | $28,800 | $91,678 |
| 2024 | $2,881 | $117,782 | $28,800 | $88,982 |
| 2023 | $2,468 | $118,182 | $28,800 | $89,382 |
| 2022 | $2,598 | $92,376 | $23,200 | $69,176 |
| 2021 | $2,258 | $76,118 | $18,800 | $57,318 |
| 2020 | $2,107 | $70,947 | $16,000 | $54,947 |
| 2019 | $2,080 | $68,575 | $16,000 | $52,575 |
| 2018 | $1,728 | $54,138 | $12,000 | $42,138 |
| 2017 | $1,483 | $50,945 | $12,000 | $38,945 |
| 2016 | $1,522 | $47,861 | $15,200 | $32,661 |
| 2015 | $1,490 | $46,574 | $15,200 | $31,374 |
| 2014 | $1,380 | $41,500 | $9,800 | $31,700 |
| 2013 | -- | $39,162 | $9,800 | $29,362 |
Source: Public Records
Map
Nearby Homes
- 921 Roxeywood Dr
- 1752 Maxey Ln
- 920 Roxeywood Dr
- 1185 Wendy Way
- 1250 Maxey Ct
- 1898 Roxey Ln
- 99 Holland Cove
- 98 Holland Cove
- Brandon Plan at Willowbrook
- ANSLEY Express Plan at Willowbrook
- ARIA Express Plan at Willowbrook
- 89 Holland Cove
- 86 Holland Cove
- 79 Holland Cove
- 74 Holland Cove
- 50 Holland Cove
- 1214 Roxey Maxey Rd
- 139 Bristol Blvd
- 81 Roxeywood Way
- 1758 Maxey Ln
- 1758 Maxey Ln Unit 1758
- 1756 Maxey Ln
- 1760 Maxey Ln
- 917 Roxeywood Dr
- 1754 Maxey Ln
- 1762 Maxey Ln
- 915 Roxeywood Dr Unit 1
- 915 Roxeywood Dr
- 1759 Maxey Ln
- 913 Roxeywood Dr
- 1761 Maxey Ln
- 1757 Maxey Ln Unit 17A
- 1757 Maxey Ln
- 1757 Maxey Ln
- 1755 Maxey Ln Unit 16A
- 1763 Maxey Ln
- 1752 Maxey Ln Unit 12A
- 911 Roxeywood Dr
Your Personal Tour Guide
Ask me questions while you tour the home.