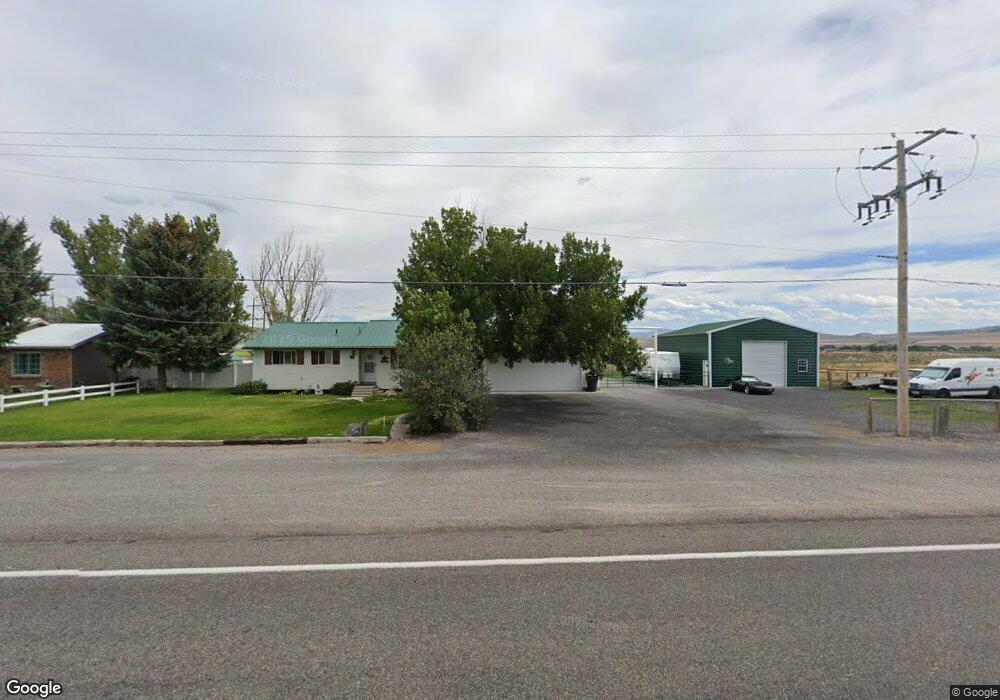
17580 N 5200 W Garland, UT 84312
Estimated Value: $473,000 - $601,107
--
Bed
--
Bath
1,266
Sq Ft
$434/Sq Ft
Est. Value
About This Home
This home is located at 17580 N 5200 W, Garland, UT 84312 and is currently estimated at $549,027, approximately $433 per square foot. 17580 N 5200 W is a home located in Box Elder County with nearby schools including Fielding School, Bear River Middle School, and Alice C. Harris Intermediate School.
Ownership History
Date
Name
Owned For
Owner Type
Purchase Details
Closed on
Jun 10, 2020
Sold by
Johnson Chanelle and Johnson Casey B
Bought by
Johnson Chanelle and Johnson Casey Brian
Current Estimated Value
Home Financials for this Owner
Home Financials are based on the most recent Mortgage that was taken out on this home.
Original Mortgage
$252,000
Outstanding Balance
$223,379
Interest Rate
3.2%
Mortgage Type
New Conventional
Estimated Equity
$325,648
Purchase Details
Closed on
Feb 19, 2015
Sold by
Rudd Michael C and Rudd Gloria C
Bought by
Toyn Chanelle and Johnson Casey B
Home Financials for this Owner
Home Financials are based on the most recent Mortgage that was taken out on this home.
Original Mortgage
$238,107
Interest Rate
3.5%
Mortgage Type
FHA
Purchase Details
Closed on
Dec 14, 2012
Sold by
Rudd Michael C and Rudd Gloria C
Bought by
Rudd Michael C and Rudd Gloria C
Create a Home Valuation Report for This Property
The Home Valuation Report is an in-depth analysis detailing your home's value as well as a comparison with similar homes in the area
Home Values in the Area
Average Home Value in this Area
Purchase History
| Date | Buyer | Sale Price | Title Company |
|---|---|---|---|
| Johnson Chanelle | -- | American Secure Title Layton | |
| Toyn Chanelle | -- | Mountain America Title | |
| Rudd Michael C | -- | Box Elder Land Title Compan | |
| Rudd Michael C | -- | Box Elder Land And Title Co |
Source: Public Records
Mortgage History
| Date | Status | Borrower | Loan Amount |
|---|---|---|---|
| Open | Johnson Chanelle | $252,000 | |
| Closed | Toyn Chanelle | $238,107 |
Source: Public Records
Tax History Compared to Growth
Tax History
| Year | Tax Paid | Tax Assessment Tax Assessment Total Assessment is a certain percentage of the fair market value that is determined by local assessors to be the total taxable value of land and additions on the property. | Land | Improvement |
|---|---|---|---|---|
| 2025 | $2,994 | $513,621 | $166,600 | $347,021 |
| 2024 | $2,642 | $511,801 | $166,600 | $345,201 |
| 2023 | $2,667 | $526,594 | $166,600 | $359,994 |
| 2022 | $2,546 | $265,961 | $47,828 | $218,133 |
| 2021 | $1,442 | $252,247 | $31,830 | $220,417 |
| 2020 | $1,489 | $252,247 | $31,830 | $220,417 |
| 2019 | $1,354 | $3,660 | $1,830 | $1,830 |
| 2018 | $1,309 | $115,287 | $18,330 | $96,957 |
| 2017 | $1,356 | $195,723 | $18,330 | $163,893 |
| 2016 | $1,302 | $111,392 | $18,330 | $93,062 |
| 2015 | $1,161 | $102,932 | $18,330 | $84,602 |
| 2014 | $1,161 | $97,904 | $16,675 | $81,229 |
| 2013 | -- | $97,908 | $16,677 | $81,231 |
Source: Public Records
Map
Nearby Homes
- 18068 N 6000 W
- 18100 N 4400 W
- 18120 N 4400 W
- 18188 N 6000 W
- 16580 N 5200 W
- 18250 N 4400 W
- 95 W 100 N
- 95 E 100 S
- 303 S Center St
- Berrington Plan at Lookout Mountain
- Stanton Plan at Lookout Mountain
- Cambria Plan at Lookout Mountain
- Brantwood Plan at Lookout Mountain
- Hallwood Plan at Lookout Mountain
- Vanbrough Plan at Lookout Mountain
- Norfolk Plan at Lookout Mountain
- Xavier Plan at Lookout Mountain
- Foxhill Plan at Lookout Mountain
- Knighton Plan at Lookout Mountain
- Winfield Plan at Lookout Mountain
- 17580 N 5200 W
- 17590 N 5200 W
- 17535 N 5200 W
- 5220 W 17600 N
- 17640 N 5200 W
- 5275 W 17600 N
- 17650 N 5200 W
- 17660 N 5200 W
- 17680 N 5200 W
- 17694 N 5200 W
- 5330 W 17600 N
- 17720 N 5200 W
- 5365 W 17600 N
- 5370 W 17600 N
- 17381 N 5200 W
- 17375 N 5200 W
- 5395 W 17600 N
- 5395 W 17600 N
- 5425 W 17600 N Unit 2
- 5425 W 17600 N Unit 4