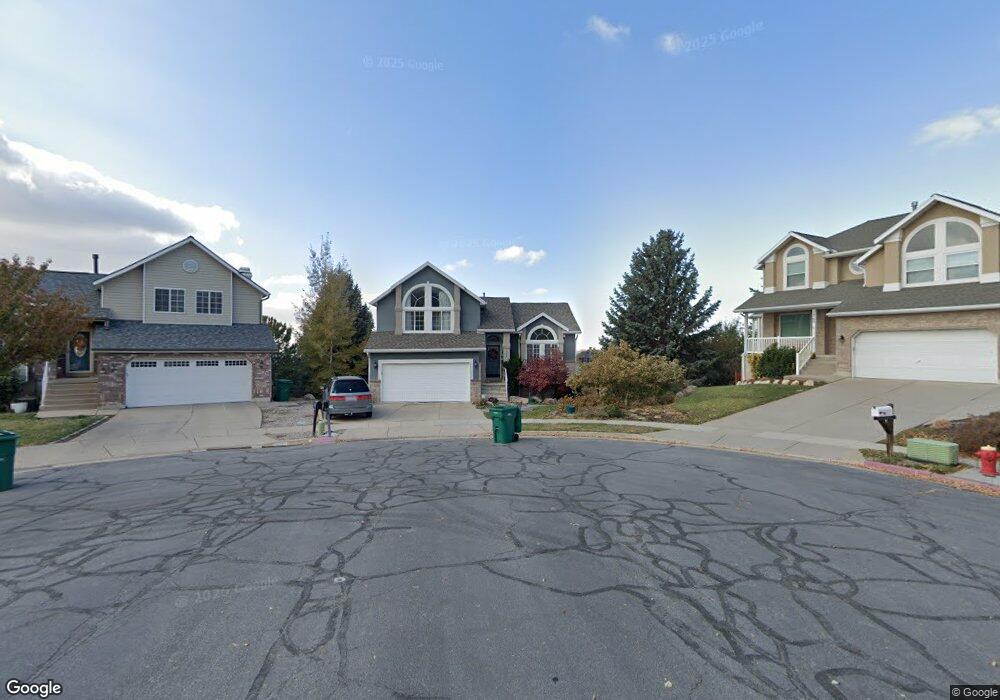
1759 E 2100 N Layton, UT 84040
Estimated Value: $574,000 - $630,913
4
Beds
4
Baths
2,892
Sq Ft
$210/Sq Ft
Est. Value
About This Home
This home is located at 1759 E 2100 N, Layton, UT 84040 and is currently estimated at $606,728, approximately $209 per square foot. 1759 E 2100 N is a home located in Davis County with nearby schools including Sarah Jane Adams Elementary School, North Layton Junior High School, and Northridge High School.
Ownership History
Date
Name
Owned For
Owner Type
Purchase Details
Closed on
Feb 28, 2013
Sold by
Wilson Adam
Bought by
Wilson Linda M
Current Estimated Value
Home Financials for this Owner
Home Financials are based on the most recent Mortgage that was taken out on this home.
Original Mortgage
$187,000
Outstanding Balance
$130,299
Interest Rate
3.34%
Mortgage Type
New Conventional
Estimated Equity
$476,429
Purchase Details
Closed on
Aug 24, 2012
Sold by
Southerland Bobby and Southerland Jeri Diane
Bought by
Wilson Adam
Purchase Details
Closed on
May 23, 2005
Sold by
Southerland Bobby
Bought by
Southerland Bobby and Southerland Jeri Diane
Home Financials for this Owner
Home Financials are based on the most recent Mortgage that was taken out on this home.
Original Mortgage
$48,380
Interest Rate
5.41%
Mortgage Type
Stand Alone Second
Create a Home Valuation Report for This Property
The Home Valuation Report is an in-depth analysis detailing your home's value as well as a comparison with similar homes in the area
Home Values in the Area
Average Home Value in this Area
Purchase History
| Date | Buyer | Sale Price | Title Company |
|---|---|---|---|
| Wilson Linda M | -- | Mountain America Title | |
| Wilson Adam | -- | Bonneville Superior | |
| Southerland Bobby | -- | -- | |
| Southerland Bobby | -- | Monument Title Agency |
Source: Public Records
Mortgage History
| Date | Status | Borrower | Loan Amount |
|---|---|---|---|
| Open | Wilson Linda M | $187,000 | |
| Previous Owner | Southerland Bobby | $48,380 | |
| Previous Owner | Southerland Bobby | $193,520 |
Source: Public Records
Tax History Compared to Growth
Tax History
| Year | Tax Paid | Tax Assessment Tax Assessment Total Assessment is a certain percentage of the fair market value that is determined by local assessors to be the total taxable value of land and additions on the property. | Land | Improvement |
|---|---|---|---|---|
| 2025 | $3,514 | $319,000 | $176,865 | $142,135 |
| 2024 | $3,334 | $308,550 | $181,118 | $127,432 |
| 2023 | $3,255 | $539,000 | $217,113 | $321,887 |
| 2022 | $3,175 | $286,550 | $151,105 | $135,445 |
| 2021 | $3,106 | $419,000 | $234,670 | $184,330 |
| 2020 | $2,823 | $363,000 | $209,844 | $153,156 |
| 2019 | $2,772 | $352,000 | $183,010 | $168,990 |
| 2018 | $2,544 | $322,000 | $159,145 | $162,855 |
| 2016 | $2,091 | $139,700 | $80,164 | $59,536 |
| 2015 | $2,022 | $129,690 | $80,164 | $49,526 |
| 2014 | $1,935 | $128,322 | $80,164 | $48,158 |
| 2013 | -- | $127,019 | $35,651 | $91,368 |
Source: Public Records
Map
Nearby Homes
- 2096 N 1450 E
- 1251 E Larkspur Way
- 1735 Hayes Dr
- 1463 Kays Creek Dr
- 1379 E Petunia Ct
- 1930 N Camellia Way E Unit 407
- 1444 E 2400 N
- 1920 N Camellia Way Unit 406
- 1305 E Larkspur Way
- 1313 E Larkspur Way
- 1308 E Larkspur Way
- Richards Plan at Eastridge Park - The Vistas
- Brynlee Plan at Eastridge Park - The Vistas
- Brynlee Plan at Eastridge Park - The Heights
- Ontario Plan at Eastridge Park - The Heights
- Mclauren Plan at Eastridge Park - The Vistas
- Escher Plan at Eastridge Park - The Vistas
- Rivershore Plan at Eastridge Park - The Vistas
- Helene Plan at Eastridge Park - The Vistas
- Bromley Plan at Eastridge Park - The Heights