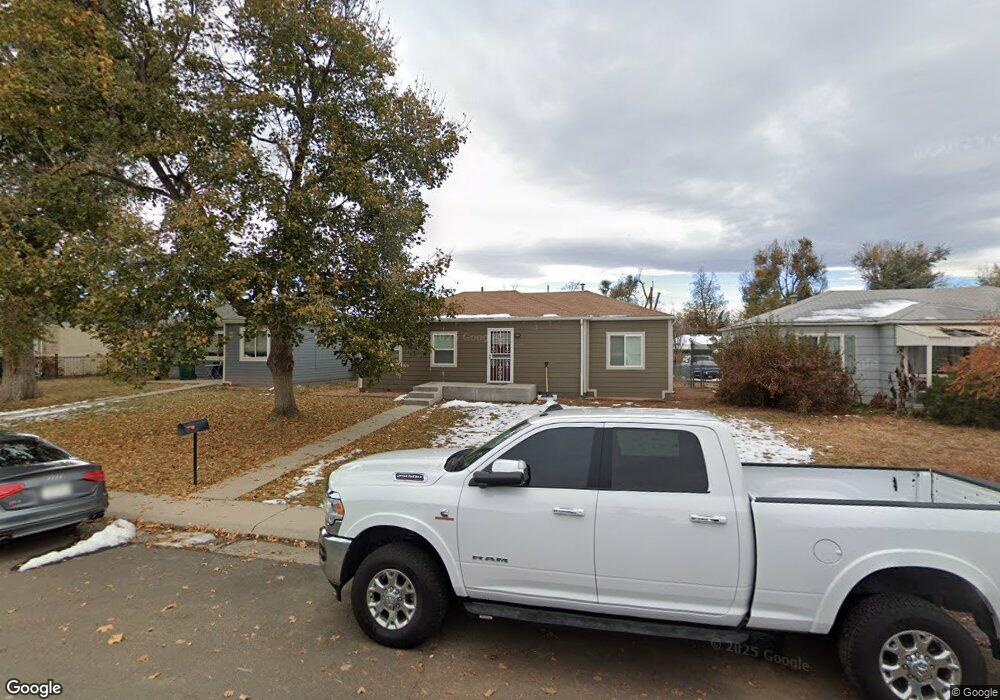
1759 Kenton St Aurora, CO 80010
North Aurora NeighborhoodEstimated Value: $334,734 - $376,000
2
Beds
1
Bath
870
Sq Ft
$410/Sq Ft
Est. Value
About This Home
This home is located at 1759 Kenton St, Aurora, CO 80010 and is currently estimated at $356,434, approximately $409 per square foot. 1759 Kenton St is a home located in Adams County with nearby schools including Montview Elementary School, Lincoln Elementary School, and Amargosa Creek Middle School.
Ownership History
Date
Name
Owned For
Owner Type
Purchase Details
Closed on
Jan 1, 2014
Sold by
Johnston Raymond D
Bought by
Braymac Holdings Llc
Current Estimated Value
Home Financials for this Owner
Home Financials are based on the most recent Mortgage that was taken out on this home.
Original Mortgage
$1,701,786
Outstanding Balance
$1,568,710
Interest Rate
12%
Mortgage Type
Seller Take Back
Estimated Equity
-$1,212,276
Purchase Details
Closed on
Oct 30, 2009
Sold by
Quertermus Rob
Bought by
Lascarco Llc
Purchase Details
Closed on
Oct 8, 2002
Sold by
The Kenneth V & Anne L Hanna Trust
Bought by
Hanna Evan V and Hanna Catherine M
Purchase Details
Closed on
Mar 9, 2000
Sold by
Hanna Kenneth V
Bought by
The Kenneth V Hanna & Anne L Hanna Trust
Create a Home Valuation Report for This Property
The Home Valuation Report is an in-depth analysis detailing your home's value as well as a comparison with similar homes in the area
Home Values in the Area
Average Home Value in this Area
Purchase History
| Date | Buyer | Sale Price | Title Company |
|---|---|---|---|
| Braymac Holdings Llc | $165,000 | None Available | |
| Lascarco Llc | -- | None Available | |
| Hanna Evan V | -- | -- | |
| The Kenneth V Hanna & Anne L Hanna Trust | -- | -- |
Source: Public Records
Mortgage History
| Date | Status | Borrower | Loan Amount |
|---|---|---|---|
| Open | Braymac Holdings Llc | $1,701,786 |
Source: Public Records
Tax History Compared to Growth
Tax History
| Year | Tax Paid | Tax Assessment Tax Assessment Total Assessment is a certain percentage of the fair market value that is determined by local assessors to be the total taxable value of land and additions on the property. | Land | Improvement |
|---|---|---|---|---|
| 2024 | $2,178 | $21,190 | $5,000 | $16,190 |
| 2023 | $2,213 | $24,490 | $5,210 | $19,280 |
| 2022 | $2,345 | $19,800 | $5,350 | $14,450 |
| 2021 | $2,345 | $19,800 | $5,350 | $14,450 |
| 2020 | $2,374 | $20,120 | $5,510 | $14,610 |
| 2019 | $3,433 | $20,120 | $5,510 | $14,610 |
| 2018 | $1,578 | $13,340 | $4,320 | $9,020 |
| 2017 | $1,402 | $13,340 | $4,320 | $9,020 |
| 2016 | $921 | $8,690 | $2,070 | $6,620 |
| 2015 | $892 | $8,690 | $2,070 | $6,620 |
| 2014 | $753 | $7,220 | $1,670 | $5,550 |
Source: Public Records
Map
Nearby Homes
- 1741 Joliet St
- 1703 Kenton St
- 1902 Kenton St
- 1745 Jamaica St
- 1732 Lansing St
- 1673 Lansing St
- 11087 Montview Blvd
- 11087 E Montview Blvd
- 1665 Lima St
- 1640 Iola St
- 1592 Lansing St Unit 1-6
- 1645 Iola St
- 2045 Lima St
- 2064 Ironton St
- 1772 Moline St
- 2028 Havana St
- 1450 Joliet St
- 2241 Ironton St
- 1764 Newark St
- 1680 Newark St