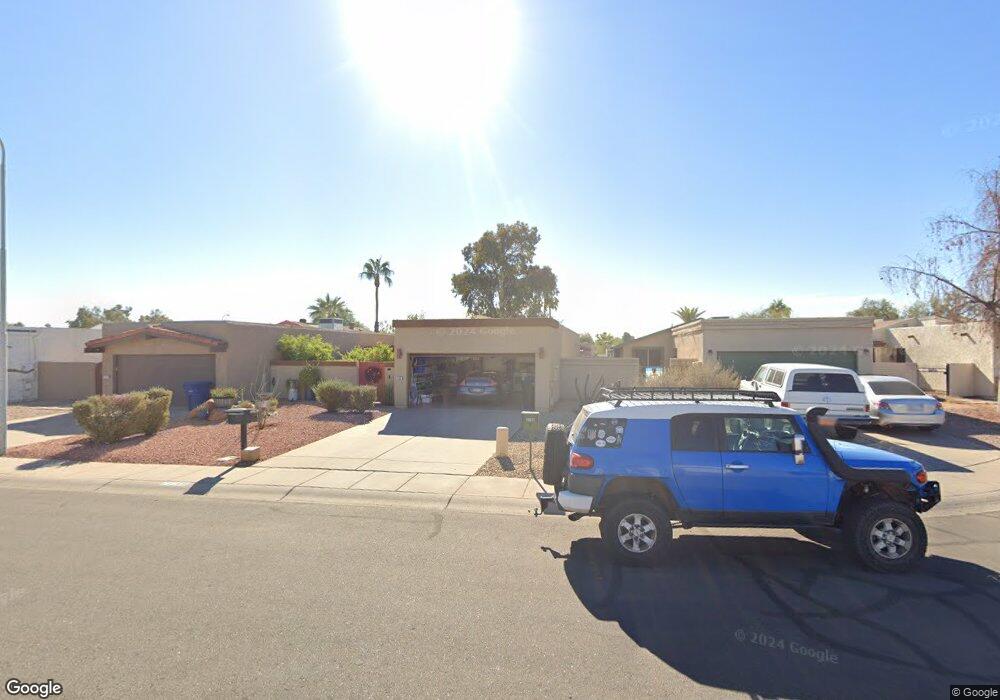
1759 W Colt Rd Chandler, AZ 85224
Amberwood NeighborhoodEstimated Value: $334,039 - $435,000
3
Beds
2
Baths
1,120
Sq Ft
$351/Sq Ft
Est. Value
About This Home
This home is located at 1759 W Colt Rd, Chandler, AZ 85224 and is currently estimated at $393,260, approximately $351 per square foot. 1759 W Colt Rd is a home located in Maricopa County with nearby schools including Pomeroy Elementary School, Franklin at Brimhall Elementary School, and Summit Academy Elementary.
Ownership History
Date
Name
Owned For
Owner Type
Purchase Details
Closed on
Nov 3, 2021
Sold by
Stein Jeffrey Joseph
Bought by
Stein Jeffrey Joseph and Stein Judith Lynn
Current Estimated Value
Purchase Details
Closed on
Mar 27, 2001
Sold by
Obrien Robert J and Obrien Sandra A
Bought by
Stein Jeffrey J
Home Financials for this Owner
Home Financials are based on the most recent Mortgage that was taken out on this home.
Original Mortgage
$103,500
Interest Rate
6.98%
Mortgage Type
New Conventional
Purchase Details
Closed on
Sep 12, 1995
Sold by
Good Terri M
Bought by
Obrien Robert J and Obrien Sandra A
Home Financials for this Owner
Home Financials are based on the most recent Mortgage that was taken out on this home.
Original Mortgage
$77,342
Interest Rate
7.97%
Mortgage Type
FHA
Purchase Details
Closed on
Feb 6, 1995
Sold by
Good Monte Alan
Bought by
Good Terri M
Create a Home Valuation Report for This Property
The Home Valuation Report is an in-depth analysis detailing your home's value as well as a comparison with similar homes in the area
Home Values in the Area
Average Home Value in this Area
Purchase History
| Date | Buyer | Sale Price | Title Company |
|---|---|---|---|
| Stein Jeffrey Joseph | -- | None Listed On Document | |
| Stein Jeffrey J | $109,000 | Security Title Agency | |
| Obrien Robert J | $77,900 | Transamerica Title Ins Co | |
| Good Terri M | -- | United Title Agency | |
| Good Terri M | $73,800 | United Title Agency |
Source: Public Records
Mortgage History
| Date | Status | Borrower | Loan Amount |
|---|---|---|---|
| Previous Owner | Stein Jeffrey J | $103,500 | |
| Previous Owner | Obrien Robert J | $77,342 |
Source: Public Records
Tax History Compared to Growth
Tax History
| Year | Tax Paid | Tax Assessment Tax Assessment Total Assessment is a certain percentage of the fair market value that is determined by local assessors to be the total taxable value of land and additions on the property. | Land | Improvement |
|---|---|---|---|---|
| 2025 | $1,126 | $13,207 | -- | -- |
| 2024 | $1,137 | $12,578 | -- | -- |
| 2023 | $1,137 | $30,020 | $6,000 | $24,020 |
| 2022 | $1,106 | $21,820 | $4,360 | $17,460 |
| 2021 | $1,112 | $19,610 | $3,920 | $15,690 |
| 2020 | $1,100 | $17,980 | $3,590 | $14,390 |
| 2019 | $1,013 | $15,650 | $3,130 | $12,520 |
| 2018 | $983 | $14,920 | $2,980 | $11,940 |
| 2017 | $946 | $13,450 | $2,690 | $10,760 |
| 2016 | $925 | $13,060 | $2,610 | $10,450 |
| 2015 | $870 | $13,410 | $2,680 | $10,730 |
Source: Public Records
Map
Nearby Homes
- 1771 W Mariposa Ct
- 2015 N Villas Ln
- 2129 N Villas Ln
- 2103 W Palomino Dr
- 1511 W Mesquite St
- 2100 W Lemon Tree Place Unit 68
- 2100 W Lemon Tree Place Unit 29
- 2100 W Lemon Tree Place Unit 78
- 1417 W Los Arboles Place
- 1719 N Cholla St
- 1645 N Saguaro St
- 2210 N Los Altos Dr
- 1403 W Los Arboles Place
- 1821 W Mission Dr
- 1621 N Longmore St
- 1807 W Mission Dr
- 2029 W Shawnee Dr
- 2615 N Yucca St
- 2221 W Rockwell Dr
- 1805 W Cheyenne Dr
- 1763 W Colt Rd
- 1755 W Colt Rd
- 1763R W Colt Rd
- 1767 W Colt Rd
- 1751 W Colt Rd
- 1771 W Colt Rd
- 1754 W Mariposa Ct
- 1758 W Mariposa Ct
- 1762 W Mariposa Ct
- 1764 W Mariposa Ct
- 1746 W Mariposa Ct
- 1775 W Colt Rd
- 1766 W Mariposa Ct
- 1758 W Colt Rd
- 1754 W Colt Rd
- 1762 W Colt Rd
- 1750 W Colt Rd
- 2067 N Villas Ln
- 2063 N Villas Ln
- 1770 W Mariposa Ct