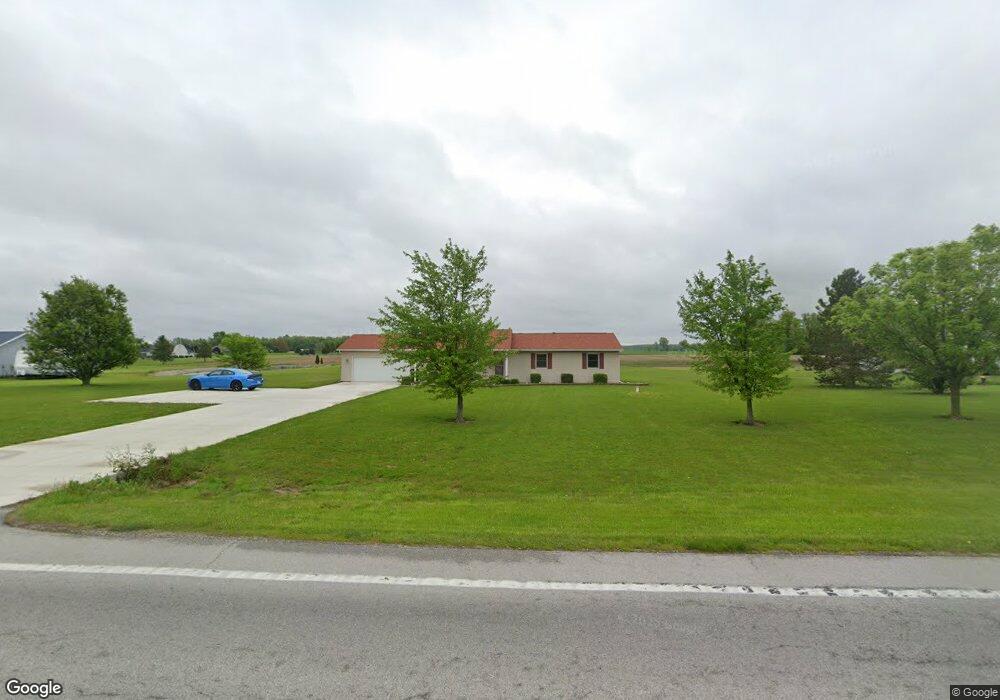
17598 State Route 66 Saint Marys, OH 45885
Estimated Value: $274,000 - $297,000
3
Beds
2
Baths
1,404
Sq Ft
$205/Sq Ft
Est. Value
About This Home
This home is located at 17598 State Route 66, Saint Marys, OH 45885 and is currently estimated at $288,520, approximately $205 per square foot. 17598 State Route 66 is a home located in Auglaize County with nearby schools including St. Mary's East Primary School, St. Mary's West Intermediate School, and St. Marys Middle School.
Ownership History
Date
Name
Owned For
Owner Type
Purchase Details
Closed on
Aug 29, 2014
Sold by
Frilling Brett M and Frilling Holly
Bought by
Morrow Jeremiah and Morrow Rena L
Current Estimated Value
Home Financials for this Owner
Home Financials are based on the most recent Mortgage that was taken out on this home.
Original Mortgage
$116,450
Outstanding Balance
$89,018
Interest Rate
4.1%
Mortgage Type
New Conventional
Estimated Equity
$199,502
Purchase Details
Closed on
Jul 31, 2007
Sold by
Cooper Christina S and Bush Christina S
Bought by
Frilling Brett M and Frilling Holly
Home Financials for this Owner
Home Financials are based on the most recent Mortgage that was taken out on this home.
Original Mortgage
$141,988
Interest Rate
6.73%
Mortgage Type
VA
Purchase Details
Closed on
Jun 13, 1997
Bought by
Cooper Christina A and Bush Shawn W
Create a Home Valuation Report for This Property
The Home Valuation Report is an in-depth analysis detailing your home's value as well as a comparison with similar homes in the area
Home Values in the Area
Average Home Value in this Area
Purchase History
| Date | Buyer | Sale Price | Title Company |
|---|---|---|---|
| Morrow Jeremiah | $141,500 | Attorney | |
| Frilling Brett M | $139,000 | Attorney | |
| Cooper Christina A | $15,000 | -- |
Source: Public Records
Mortgage History
| Date | Status | Borrower | Loan Amount |
|---|---|---|---|
| Open | Morrow Jeremiah | $116,450 | |
| Previous Owner | Frilling Brett M | $141,988 |
Source: Public Records
Tax History Compared to Growth
Tax History
| Year | Tax Paid | Tax Assessment Tax Assessment Total Assessment is a certain percentage of the fair market value that is determined by local assessors to be the total taxable value of land and additions on the property. | Land | Improvement |
|---|---|---|---|---|
| 2024 | $5,671 | $78,070 | $10,280 | $67,790 |
| 2023 | $2,928 | $78,070 | $10,280 | $67,790 |
| 2022 | $2,283 | $54,230 | $9,350 | $44,880 |
| 2021 | $2,263 | $54,230 | $9,350 | $44,880 |
| 2020 | $2,268 | $54,226 | $9,349 | $44,877 |
| 2019 | $2,110 | $48,857 | $8,348 | $40,509 |
| 2018 | $2,019 | $46,642 | $8,348 | $38,294 |
| 2017 | $2,022 | $46,642 | $8,348 | $38,294 |
| 2016 | $1,893 | $43,873 | $7,949 | $35,924 |
| 2015 | $1,855 | $43,873 | $7,949 | $35,924 |
| 2014 | $1,924 | $43,873 | $7,949 | $35,924 |
| 2013 | $1,927 | $43,873 | $7,949 | $35,924 |
Source: Public Records
Map
Nearby Homes
- 17501 County Road 66a
- 18341 Saint Marys River Rd
- 0 State Route 364 Unit 1023925
- 363 Miami Erie Cir
- 357 Miami Erie Cir
- 309 Miami Erie Cir
- 375 Miami Erie Cir
- 341 Miami Erie Cir
- 385 Miami Erie Cir
- 367 Miami Erie Cir
- 313 Miami Erie Cir
- 374 Miami Erie Cir
- 364 Miami Erie Cir
- 366 Miami Erie Cir
- 386 Miami Erie Cir
- 390 Miami Erie Cir
- 317 Miami Erie Cir
- 308 Miami Erie Cir
- 316 Miami Erie Cir
- 324 Miami Erie Cir
- 17642 State Route 66
- 17578 State Route 66
- 17686 State Route 66
- 5066 Sandkuhl Rd
- 05066 Sandkuhl Rd
- 05114 Sandkuhl Rd
- 17735 State Route 66
- 05150 Sandkuhl Rd
- 05041 Sandkuhl Rd
- 5150 Sandkuhl Rd
- 05125 Sandkuhl Rd
- 05188 Sandkuhl Rd
- 17806 State Route 66
- 05228 Sandkuhl Rd
- 05181 Sandkuhl Rd
- 17840 State Route
- 17840 Sr
- 17840 Sr 66
- 17840 State Route 66
- 17857 State Route 66