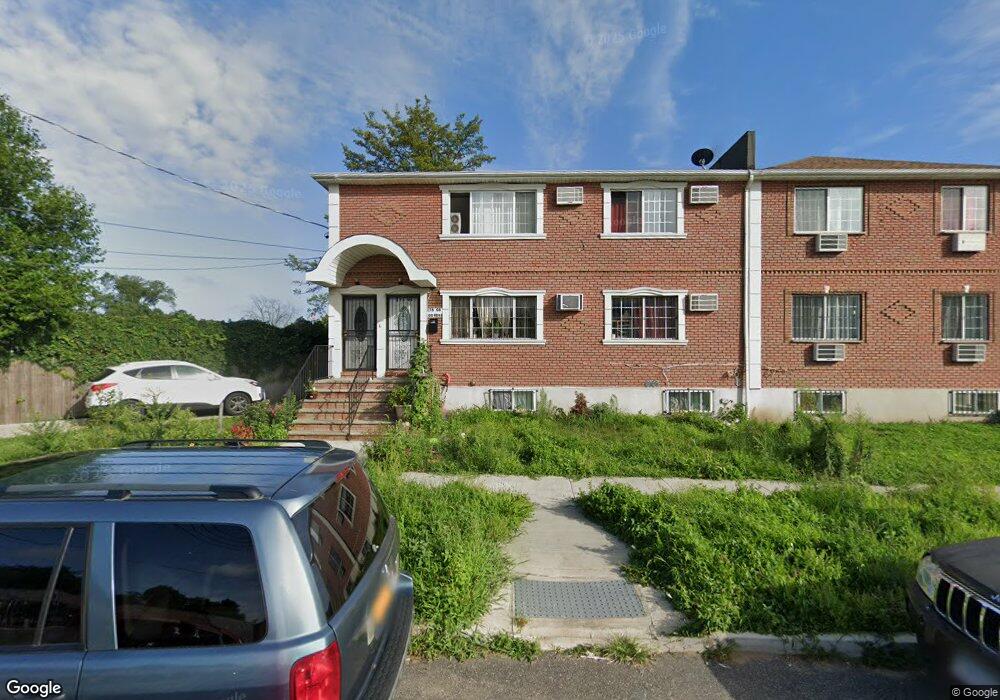
176-08 108 Rd Jamaica, NY 11433
Jamaica NeighborhoodEstimated Value: $691,000 - $1,153,000
6
Beds
6
Baths
2,010
Sq Ft
$456/Sq Ft
Est. Value
About This Home
This home is located at 176-08 108 Rd, Jamaica, NY 11433 and is currently estimated at $917,025, approximately $456 per square foot. 176-08 108 Rd is a home located in Queens County with nearby schools including P.S./I.S. 116 William C Hughley and I.S. 238 Susan B Anthony Academy.
Ownership History
Date
Name
Owned For
Owner Type
Purchase Details
Closed on
May 26, 2016
Sold by
212 Jamaica Realty Llc
Bought by
Antonio Juan M and Martinez Ana
Current Estimated Value
Home Financials for this Owner
Home Financials are based on the most recent Mortgage that was taken out on this home.
Original Mortgage
$598,850
Outstanding Balance
$476,928
Interest Rate
3.59%
Mortgage Type
Purchase Money Mortgage
Estimated Equity
$440,097
Purchase Details
Closed on
Feb 22, 2016
Sold by
Jpa Realty Inc Defined Benifit Plan
Bought by
212 Jamaica Realty Llc
Purchase Details
Closed on
Feb 3, 2016
Sold by
Pensco Trust Co Cust Fbo Joseph Atarien
Bought by
Jpa Realty Inc Defined Benefit Plan
Purchase Details
Closed on
Mar 24, 2011
Sold by
Jpa Realty Inc
Bought by
Pensco Trust Co Cust
Purchase Details
Closed on
Dec 15, 2006
Sold by
Mass Development Inc
Bought by
Jpa Realty Inc Defined Benefit Plan
Purchase Details
Closed on
Oct 24, 2006
Sold by
Godfrey Shellie S and Lloyd Ulysses
Bought by
Mass Development Inc
Create a Home Valuation Report for This Property
The Home Valuation Report is an in-depth analysis detailing your home's value as well as a comparison with similar homes in the area
Home Values in the Area
Average Home Value in this Area
Purchase History
| Date | Buyer | Sale Price | Title Company |
|---|---|---|---|
| Antonio Juan M | $711,757 | -- | |
| 212 Jamaica Realty Llc | $300,000 | -- | |
| Jpa Realty Inc Defined Benefit Plan | -- | -- | |
| Pensco Trust Co Cust | -- | -- | |
| Jpa Realty Inc Defined Benefit Plan | $225,000 | -- | |
| Mass Development Inc | $20,000 | -- |
Source: Public Records
Mortgage History
| Date | Status | Borrower | Loan Amount |
|---|---|---|---|
| Open | Antonio Juan M | $598,850 |
Source: Public Records
Tax History Compared to Growth
Tax History
| Year | Tax Paid | Tax Assessment Tax Assessment Total Assessment is a certain percentage of the fair market value that is determined by local assessors to be the total taxable value of land and additions on the property. | Land | Improvement |
|---|---|---|---|---|
| 2025 | $4,158 | $21,942 | $11,901 | $10,041 |
| 2024 | $4,158 | $20,700 | $14,081 | $6,619 |
| 2023 | $4,109 | $20,460 | $14,957 | $5,503 |
| 2022 | $4,288 | $21,480 | $13,440 | $8,040 |
| 2021 | $4,836 | $22,980 | $13,440 | $9,540 |
| 2020 | $5,347 | $25,260 | $13,440 | $11,820 |
| 2019 | $5,824 | $27,840 | $13,440 | $14,400 |
| 2018 | $6,461 | $31,696 | $13,075 | $18,621 |
| 2017 | $6,461 | $31,696 | $11,563 | $20,133 |
| 2016 | $6,029 | $31,696 | $11,563 | $20,133 |
| 2015 | $442 | $28,420 | $6,341 | $22,079 |
| 2014 | $442 | $23,133 | $5,929 | $17,204 |
Source: Public Records
Map
Nearby Homes
- 10779 Watson Place
- 10912 176th St
- 108-32 174th St
- 10828 174th St
- 10944 177th St
- 17702 106th Rd
- 109-49 176th St
- 110-01 175th St
- 177-33 106th Rd
- 177-18 106th Ave
- 106-03 177th St
- 172-09 108th Ave
- 173-61 105th Ave
- 110-40 176th St
- 104-07 177th St
- 108-46 171st Place
- 177-53 105th Ave
- 10519 171st Place
- 11023 172nd St
- 11008 172nd St
- 10848 176th St
- 108-52 176th St
- 10844 176th St
- 108-41 176th St
- 10807 176th St
- 10841 176th St
- 17601 109th Ave
- 10852 176th St
- 10840 176th St
- 17517 109th Ave
- 17608 108th Rd
- 17515 109th Ave
- 10836 176th St
- 17511 109th Ave
- 17416 109th Ave
- 17509 109th Ave
- 10834 176th St
- 110-04 176 St
- 10835 175th St
- 10831 175th St