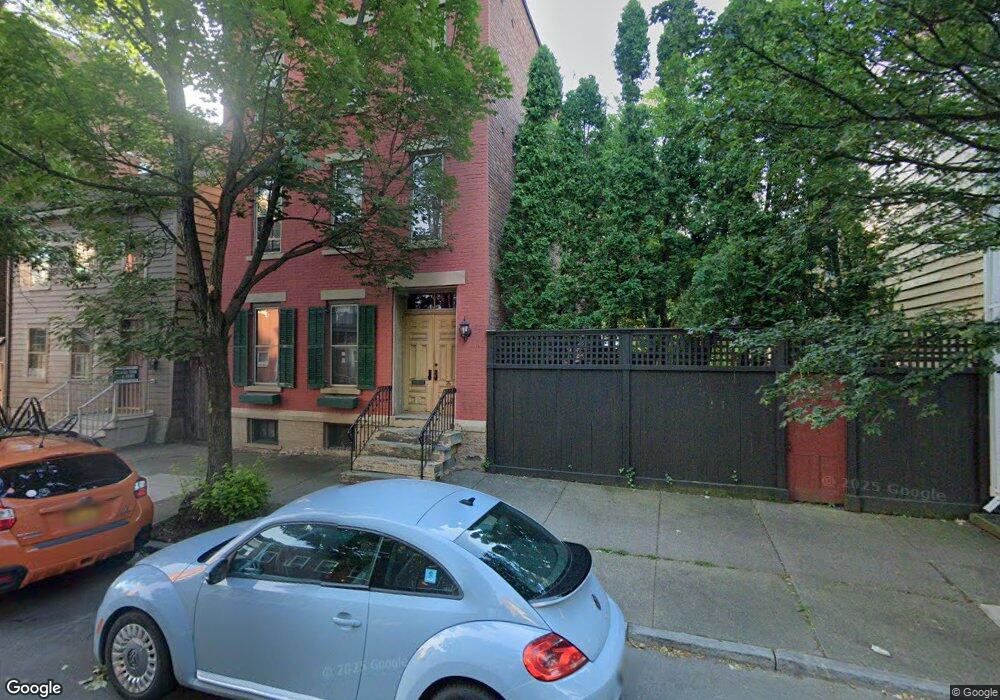
176 4th St Troy, NY 12180
South Central NeighborhoodEstimated Value: $318,000 - $451,000
6
Beds
3
Baths
3,240
Sq Ft
$114/Sq Ft
Est. Value
About This Home
This home is located at 176 4th St, Troy, NY 12180 and is currently estimated at $370,453, approximately $114 per square foot. 176 4th St is a home located in Rensselaer County with nearby schools including P.S. 14, Troy Middle School, and Troy High School.
Ownership History
Date
Name
Owned For
Owner Type
Purchase Details
Closed on
Sep 24, 2015
Sold by
Macneil - Estate Cheryl
Bought by
Watson Elbert
Current Estimated Value
Home Financials for this Owner
Home Financials are based on the most recent Mortgage that was taken out on this home.
Original Mortgage
$170,100
Outstanding Balance
$133,875
Interest Rate
3.97%
Mortgage Type
Purchase Money Mortgage
Estimated Equity
$236,578
Purchase Details
Closed on
Aug 13, 1999
Sold by
Rush John J
Bought by
Macneil Cheryl
Create a Home Valuation Report for This Property
The Home Valuation Report is an in-depth analysis detailing your home's value as well as a comparison with similar homes in the area
Home Values in the Area
Average Home Value in this Area
Purchase History
| Date | Buyer | Sale Price | Title Company |
|---|---|---|---|
| Watson Elbert | $189,000 | Jessica Desany | |
| Macneil Cheryl | $59,900 | Maura Mottolese |
Source: Public Records
Mortgage History
| Date | Status | Borrower | Loan Amount |
|---|---|---|---|
| Open | Watson Elbert | $170,100 |
Source: Public Records
Tax History
| Year | Tax Paid | Tax Assessment Tax Assessment Total Assessment is a certain percentage of the fair market value that is determined by local assessors to be the total taxable value of land and additions on the property. | Land | Improvement |
|---|---|---|---|---|
| 2024 | $7,707 | $165,000 | $8,800 | $156,200 |
| 2023 | $7,619 | $165,000 | $8,800 | $156,200 |
| 2022 | $7,475 | $165,000 | $8,800 | $156,200 |
| 2021 | $1,879 | $165,000 | $8,800 | $156,200 |
| 2020 | $3,800 | $165,000 | $8,800 | $156,200 |
| 2019 | $5,397 | $165,000 | $8,800 | $156,200 |
| 2018 | $5,397 | $165,000 | $8,800 | $156,200 |
| 2017 | $5,372 | $165,000 | $8,800 | $156,200 |
| 2016 | $4,992 | $116,000 | $8,800 | $107,200 |
| 2015 | -- | $116,000 | $8,800 | $107,200 |
| 2014 | -- | $116,000 | $8,800 | $107,200 |
Source: Public Records
Map
Nearby Homes
Your Personal Tour Guide
Ask me questions while you tour the home.