Estimated Value: $372,000 - $531,000
--
Bed
--
Bath
1,296
Sq Ft
$338/Sq Ft
Est. Value
About This Home
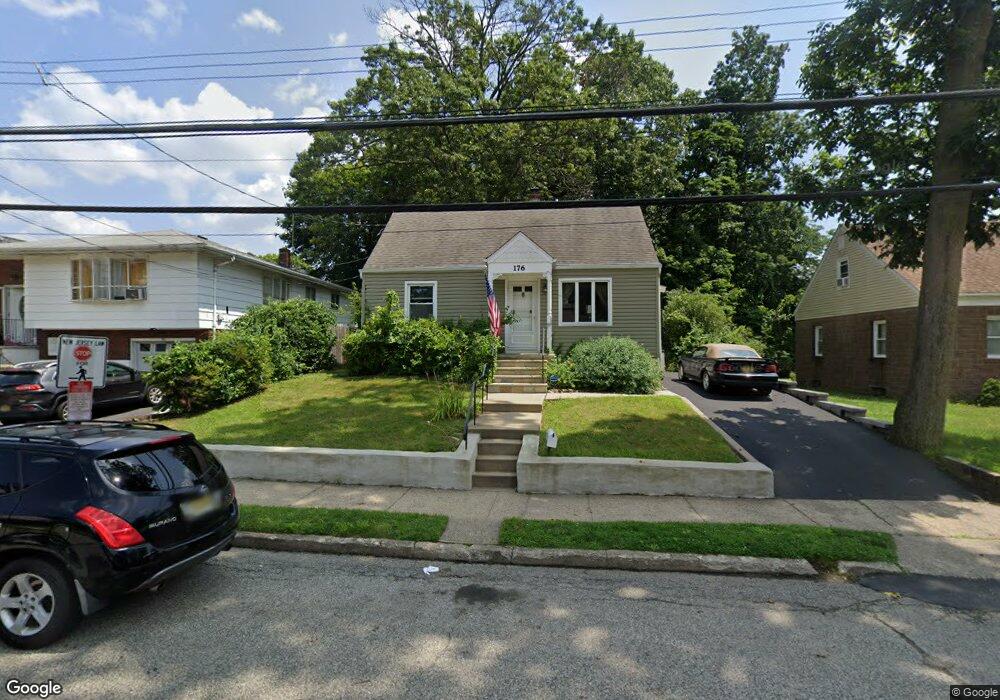
This home is located at 176 Baker St, Dover, NJ 07801 and is currently estimated at $438,478, approximately $338 per square foot. 176 Baker St is a home located in Morris County with nearby schools including Marie V. Duffy Elementary School and A C Mac Kinnon Middle School.
Ownership History
Date
Name
Owned For
Owner Type
Purchase Details
Closed on
Feb 11, 2022
Sold by
Yanega Eric Fedin
Bought by
Yanega Eric Fedin
Current Estimated Value
Home Financials for this Owner
Home Financials are based on the most recent Mortgage that was taken out on this home.
Original Mortgage
$172,000
Interest Rate
6.71%
Mortgage Type
Seller Take Back
Purchase Details
Closed on
Sep 27, 1989
Bought by
Yanega Diane Fedin and Yanega Martin J
Create a Home Valuation Report for This Property
The Home Valuation Report is an in-depth analysis detailing your home's value as well as a comparison with similar homes in the area
Home Values in the Area
Average Home Value in this Area
Purchase History
| Date | Buyer | Sale Price | Title Company |
|---|---|---|---|
| Yanega Eric Fedin | $204,000 | None Listed On Document | |
| Yanega Eric Fedin | $204,000 | None Listed On Document | |
| Yanega Diane Fedin | $132,000 | -- |
Source: Public Records
Mortgage History
| Date | Status | Borrower | Loan Amount |
|---|---|---|---|
| Previous Owner | Yanega Eric Fedin | $172,000 |
Source: Public Records
Tax History Compared to Growth
Tax History
| Year | Tax Paid | Tax Assessment Tax Assessment Total Assessment is a certain percentage of the fair market value that is determined by local assessors to be the total taxable value of land and additions on the property. | Land | Improvement |
|---|---|---|---|---|
| 2025 | $7,377 | $225,400 | $99,200 | $126,200 |
| 2024 | $7,116 | $225,400 | $99,200 | $126,200 |
| 2023 | $7,116 | $225,400 | $99,200 | $126,200 |
| 2022 | $6,543 | $225,400 | $99,200 | $126,200 |
| 2021 | $6,147 | $225,400 | $99,200 | $126,200 |
| 2020 | $6,413 | $225,400 | $99,200 | $126,200 |
| 2019 | $6,147 | $225,400 | $99,200 | $126,200 |
| 2018 | $5,809 | $225,400 | $99,200 | $126,200 |
| 2017 | $5,545 | $225,400 | $99,200 | $126,200 |
| 2016 | $5,414 | $225,400 | $99,200 | $126,200 |
| 2015 | $5,236 | $254,800 | $132,000 | $122,800 |
| 2014 | $5,183 | $254,800 | $132,000 | $122,800 |
Source: Public Records
Map
Nearby Homes