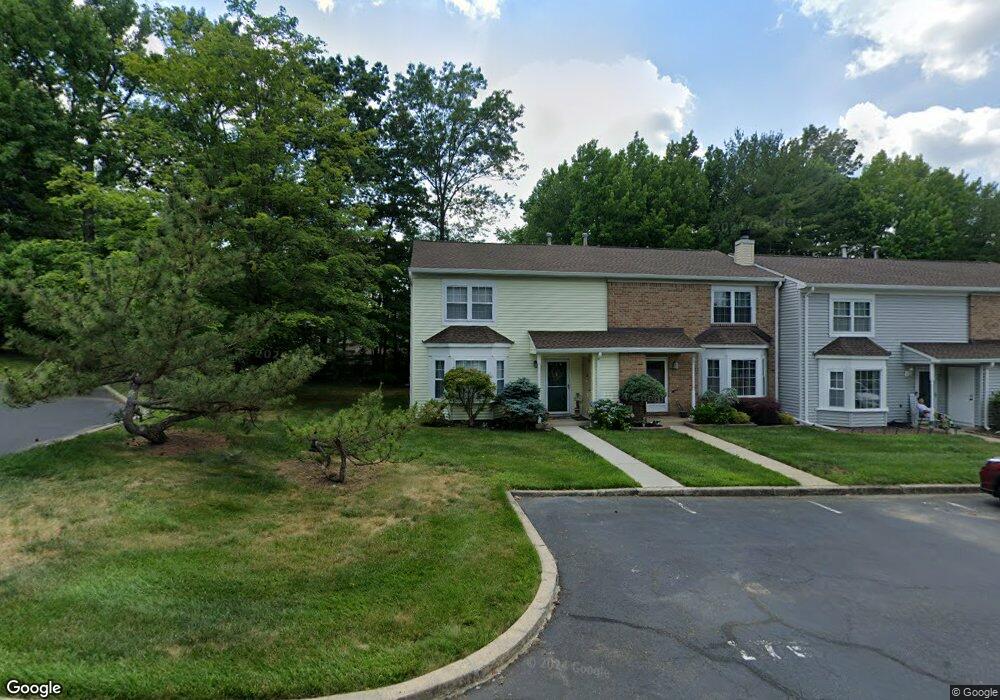
176 Bristol Ct Old Bridge, NJ 08857
Estimated Value: $440,492 - $483,000
--
Bed
--
Bath
1,452
Sq Ft
$321/Sq Ft
Est. Value
About This Home
This home is located at 176 Bristol Ct, Old Bridge, NJ 08857 and is currently estimated at $465,623, approximately $320 per square foot. 176 Bristol Ct is a home located in Middlesex County with nearby schools including Old Bridge High School, St. Ambrose School, and Minding Miracles Learning Center.
Ownership History
Date
Name
Owned For
Owner Type
Purchase Details
Closed on
May 19, 2003
Sold by
Murphy Lawrence
Bought by
Provenzano Lisa
Current Estimated Value
Home Financials for this Owner
Home Financials are based on the most recent Mortgage that was taken out on this home.
Original Mortgage
$133,500
Outstanding Balance
$56,625
Interest Rate
5.46%
Estimated Equity
$408,998
Purchase Details
Closed on
May 27, 1999
Sold by
Howell Jason
Bought by
Murphy Lawrence
Home Financials for this Owner
Home Financials are based on the most recent Mortgage that was taken out on this home.
Original Mortgage
$121,000
Interest Rate
7.09%
Purchase Details
Closed on
Mar 11, 1994
Sold by
Munoz Anthony
Bought by
Howell Jason and Howell Lori
Home Financials for this Owner
Home Financials are based on the most recent Mortgage that was taken out on this home.
Original Mortgage
$98,000
Interest Rate
7.15%
Create a Home Valuation Report for This Property
The Home Valuation Report is an in-depth analysis detailing your home's value as well as a comparison with similar homes in the area
Home Values in the Area
Average Home Value in this Area
Purchase History
| Date | Buyer | Sale Price | Title Company |
|---|---|---|---|
| Provenzano Lisa | $215,000 | -- | |
| Murphy Lawrence | $127,700 | -- | |
| Howell Jason | $103,000 | -- |
Source: Public Records
Mortgage History
| Date | Status | Borrower | Loan Amount |
|---|---|---|---|
| Open | Provenzano Lisa | $133,500 | |
| Previous Owner | Murphy Lawrence | $121,000 | |
| Previous Owner | Howell Jason | $98,000 |
Source: Public Records
Tax History Compared to Growth
Tax History
| Year | Tax Paid | Tax Assessment Tax Assessment Total Assessment is a certain percentage of the fair market value that is determined by local assessors to be the total taxable value of land and additions on the property. | Land | Improvement |
|---|---|---|---|---|
| 2025 | $6,524 | $113,500 | $40,000 | $73,500 |
| 2024 | $6,267 | $113,500 | $40,000 | $73,500 |
| 2023 | $6,267 | $113,500 | $40,000 | $73,500 |
| 2022 | $6,073 | $113,500 | $40,000 | $73,500 |
| 2021 | $4,164 | $113,500 | $40,000 | $73,500 |
| 2020 | $5,901 | $113,500 | $40,000 | $73,500 |
| 2019 | $5,810 | $113,500 | $40,000 | $73,500 |
| 2018 | $5,740 | $113,500 | $40,000 | $73,500 |
| 2017 | $5,564 | $113,500 | $40,000 | $73,500 |
| 2016 | $5,450 | $113,500 | $40,000 | $73,500 |
| 2015 | $5,358 | $113,500 | $40,000 | $73,500 |
| 2014 | $5,303 | $113,500 | $40,000 | $73,500 |
Source: Public Records
Map
Nearby Homes