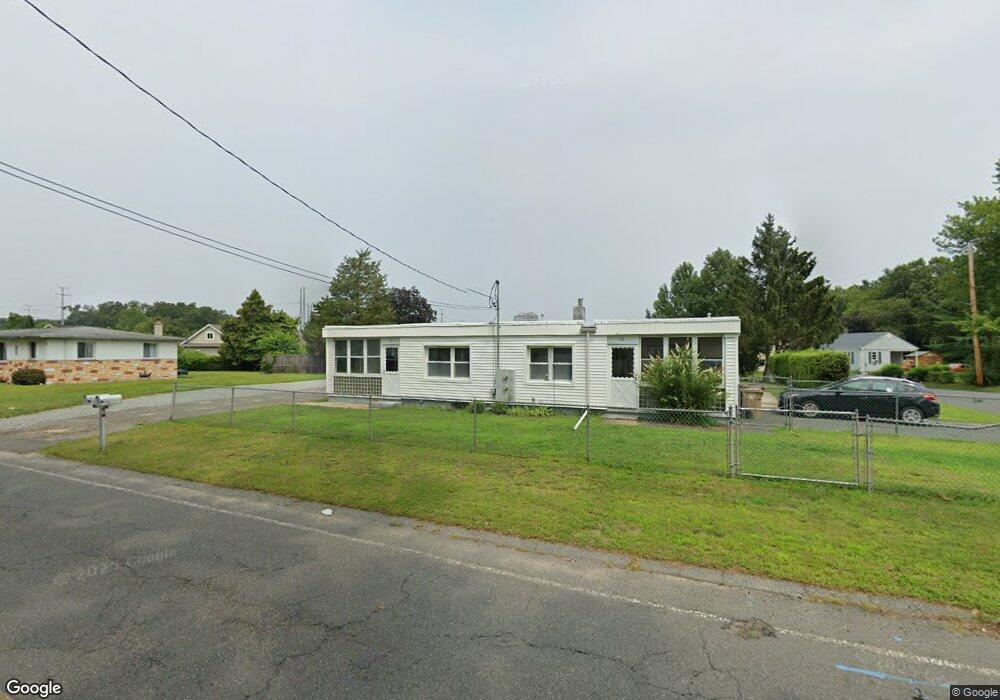
176 Cady St Unit 178 Ludlow, MA 01056
Estimated Value: $336,000 - $395,000
4
Beds
2
Baths
1,846
Sq Ft
$196/Sq Ft
Est. Value
About This Home
This home is located at 176 Cady St Unit 178, Ludlow, MA 01056 and is currently estimated at $362,616, approximately $196 per square foot. 176 Cady St Unit 178 is a home located in Hampden County with nearby schools including East Street Elementary School, Chapin Street Elementary School, and Paul R. Baird Middle School.
Ownership History
Date
Name
Owned For
Owner Type
Purchase Details
Closed on
Dec 3, 2024
Sold by
Santos Vickie A and Santos Jorge D
Bought by
Gosselin Devin and Seibold Julia M
Current Estimated Value
Home Financials for this Owner
Home Financials are based on the most recent Mortgage that was taken out on this home.
Original Mortgage
$308,750
Outstanding Balance
$305,559
Interest Rate
6.44%
Mortgage Type
Purchase Money Mortgage
Estimated Equity
$57,057
Purchase Details
Closed on
Dec 9, 2014
Sold by
Santos Shawn
Bought by
Santos Sheri
Purchase Details
Closed on
Feb 6, 2013
Sold by
Santos Jorge D and Santos Vickie A
Bought by
Santos Shawn and Santos Sheri
Purchase Details
Closed on
Sep 5, 1972
Bought by
Santos Jorge D and Santos Vickie A
Create a Home Valuation Report for This Property
The Home Valuation Report is an in-depth analysis detailing your home's value as well as a comparison with similar homes in the area
Home Values in the Area
Average Home Value in this Area
Purchase History
| Date | Buyer | Sale Price | Title Company |
|---|---|---|---|
| Gosselin Devin | $325,000 | None Available | |
| Gosselin Devin | $325,000 | None Available | |
| Gosselin Devin | $325,000 | None Available | |
| Santos Sheri | -- | -- | |
| Santos Sheri | -- | -- | |
| Santos Shawn | -- | -- | |
| Santos Shawn | -- | -- | |
| Santos Jorge D | $22,500 | -- |
Source: Public Records
Mortgage History
| Date | Status | Borrower | Loan Amount |
|---|---|---|---|
| Open | Gosselin Devin | $308,750 | |
| Closed | Gosselin Devin | $308,750 |
Source: Public Records
Tax History Compared to Growth
Tax History
| Year | Tax Paid | Tax Assessment Tax Assessment Total Assessment is a certain percentage of the fair market value that is determined by local assessors to be the total taxable value of land and additions on the property. | Land | Improvement |
|---|---|---|---|---|
| 2025 | $4,950 | $285,300 | $77,200 | $208,100 |
| 2024 | $4,721 | $261,000 | $77,000 | $184,000 |
| 2023 | $4,661 | $238,900 | $67,600 | $171,300 |
| 2022 | $4,580 | $229,100 | $67,600 | $161,500 |
| 2021 | $4,433 | $210,300 | $67,600 | $142,700 |
| 2020 | $4,246 | $205,900 | $66,600 | $139,300 |
| 2019 | $3,988 | $201,200 | $65,900 | $135,300 |
| 2018 | $3,817 | $200,800 | $65,900 | $134,900 |
| 2017 | $3,682 | $198,700 | $64,000 | $134,700 |
| 2016 | $3,492 | $192,600 | $62,700 | $129,900 |
| 2015 | $3,273 | $189,300 | $62,000 | $127,300 |
Source: Public Records
Map
Nearby Homes