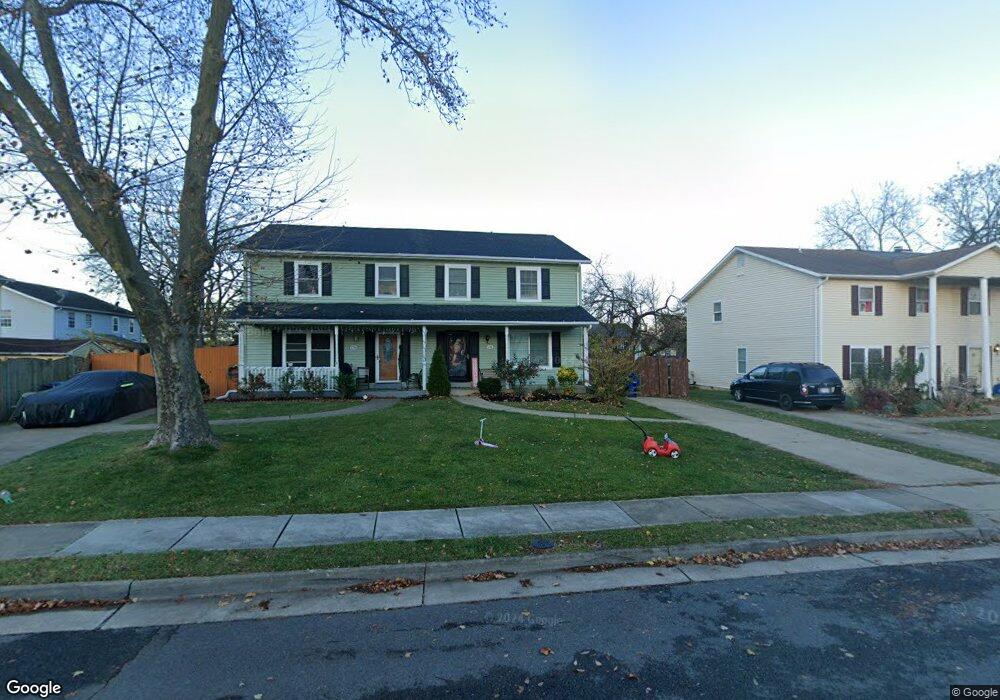
176 Cedar Walk Cir NE Leesburg, VA 20176
Estimated Value: $421,000 - $521,435
--
Bed
3
Baths
1,496
Sq Ft
$316/Sq Ft
Est. Value
About This Home
This home is located at 176 Cedar Walk Cir NE, Leesburg, VA 20176 and is currently estimated at $472,359, approximately $315 per square foot. 176 Cedar Walk Cir NE is a home located in Loudoun County with nearby schools including Cool Spring Elementary School, Harper Park Middle School, and Heritage High School.
Ownership History
Date
Name
Owned For
Owner Type
Purchase Details
Closed on
Oct 29, 2019
Sold by
Flores Olivia Del Carmen and Flores Noe
Bought by
Flores Garcia Karen Aida
Current Estimated Value
Home Financials for this Owner
Home Financials are based on the most recent Mortgage that was taken out on this home.
Original Mortgage
$208,500
Outstanding Balance
$162,461
Interest Rate
3.65%
Mortgage Type
New Conventional
Estimated Equity
$309,898
Purchase Details
Closed on
Sep 12, 2014
Sold by
Flores Olivia D C and Flores Noe
Bought by
Flores Olivia D C and Garcia Karen A F
Purchase Details
Closed on
Sep 28, 2004
Sold by
Everline Jennifer A
Bought by
Carmen Flores Olivia Del
Home Financials for this Owner
Home Financials are based on the most recent Mortgage that was taken out on this home.
Original Mortgage
$200,000
Interest Rate
5.81%
Mortgage Type
New Conventional
Create a Home Valuation Report for This Property
The Home Valuation Report is an in-depth analysis detailing your home's value as well as a comparison with similar homes in the area
Home Values in the Area
Average Home Value in this Area
Purchase History
| Date | Buyer | Sale Price | Title Company |
|---|---|---|---|
| Flores Garcia Karen Aida | -- | None Available | |
| Flores Olivia D C | -- | -- | |
| Carmen Flores Olivia Del | $249,942 | -- |
Source: Public Records
Mortgage History
| Date | Status | Borrower | Loan Amount |
|---|---|---|---|
| Open | Flores Garcia Karen Aida | $208,500 | |
| Previous Owner | Carmen Flores Olivia Del | $200,000 |
Source: Public Records
Tax History Compared to Growth
Tax History
| Year | Tax Paid | Tax Assessment Tax Assessment Total Assessment is a certain percentage of the fair market value that is determined by local assessors to be the total taxable value of land and additions on the property. | Land | Improvement |
|---|---|---|---|---|
| 2025 | $3,553 | $441,420 | $190,000 | $251,420 |
| 2024 | $3,627 | $419,290 | $140,000 | $279,290 |
| 2023 | $3,338 | $381,450 | $140,000 | $241,450 |
| 2022 | $3,337 | $374,970 | $110,000 | $264,970 |
| 2021 | $3,357 | $342,500 | $110,000 | $232,500 |
| 2020 | $3,213 | $310,440 | $100,000 | $210,440 |
| 2019 | $2,817 | $269,580 | $85,000 | $184,580 |
| 2018 | $2,777 | $255,960 | $80,000 | $175,960 |
| 2017 | $2,859 | $254,160 | $80,000 | $174,160 |
| 2016 | $2,811 | $245,540 | $0 | $0 |
| 2015 | $398 | $162,310 | $0 | $162,310 |
| 2014 | $374 | $149,200 | $0 | $149,200 |
Source: Public Records
Map
Nearby Homes
- 251 Meadows Ln NE
- BIRKHALL Plan at Brickyard
- BALMORAL Plan at Brickyard
- HIGHGROVE Plan at Brickyard
- 111 Washington St NE
- 101 Fort Evans Rd SE Unit F
- 710 North St NE
- 1117 Huntmaster Terrace NE Unit 101
- 1102 Huntmaster Terrace NE Unit 301
- 1106 Huntmaster Terrace NE Unit 202
- 1129 Huntmaster Terrace NE Unit 301
- 412 Blue Ridge Ave NE
- 1148 Keokuk Terrace NE
- 1636 Field Sparrow Terrace NE
- 1629 Field Sparrow Terrace NE
- 615 Rockbridge Dr SE
- 510 Ginkgo Terrace NE
- 1504 Shields Terrace NE
- 589 Rockbridge Dr SE
- 1515 Artillery Terrace NE
- 178 Cedar Walk Cir NE
- 174 Cedar Walk Cir NE
- 172 Cedar Walk Cir NE
- 188 Cedar Walk Cir NE
- 190 Cedar Walk Cir NE
- 136 Cedar Walk Cir NE
- 192 Cedar Walk Cir NE
- 138 Cedar Walk Cir NE
- 134 Cedar Walk Cir NE
- 140 Cedar Walk Cir NE
- 194 Cedar Walk Cir NE
- 158 Cedar Walk Cir NE
- 160 Cedar Walk Cir NE
- 156 Cedar Walk Cir NE
- 175 Cedar Walk Cir NE
- 177 Cedar Walk Cir NE
- 154 Cedar Walk Cir NE
- 179 Cedar Walk Cir NE
- 196 Cedar Walk Cir NE
- 171 Cedar Walk Cir NE