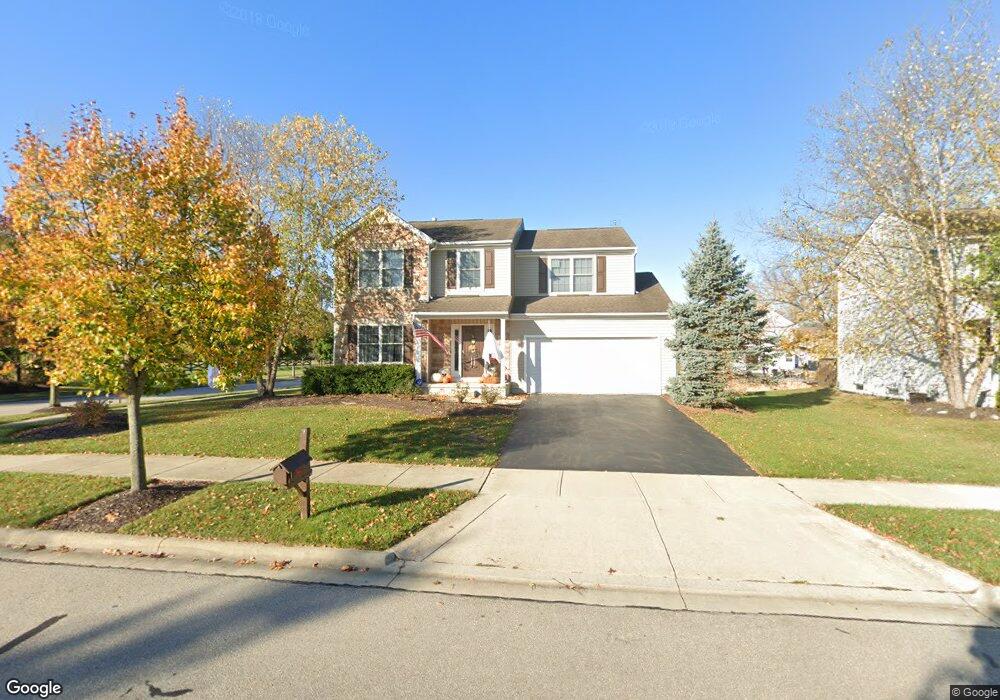
176 Cheshire Crossing Dr Unit 8839 Delaware, OH 43015
Estimated Value: $507,000 - $598,000
4
Beds
3
Baths
2,400
Sq Ft
$223/Sq Ft
Est. Value
About This Home
This home is located at 176 Cheshire Crossing Dr Unit 8839, Delaware, OH 43015 and is currently estimated at $534,143, approximately $222 per square foot. 176 Cheshire Crossing Dr Unit 8839 is a home located in Delaware County with nearby schools including Cheshire Elementary School, Hyatts Middle School, and Olentangy Berlin High School.
Ownership History
Date
Name
Owned For
Owner Type
Purchase Details
Closed on
Jul 20, 2016
Sold by
Wosiak Thomas D and Wosiak Laura
Bought by
Bibler John C and Bibler Amy L
Current Estimated Value
Home Financials for this Owner
Home Financials are based on the most recent Mortgage that was taken out on this home.
Original Mortgage
$327,461
Outstanding Balance
$261,244
Interest Rate
3.56%
Mortgage Type
VA
Estimated Equity
$272,899
Purchase Details
Closed on
Feb 1, 2006
Sold by
Gmac Model Home Finance Llc
Bought by
Wosiak Thomas and Wosiak Laura
Home Financials for this Owner
Home Financials are based on the most recent Mortgage that was taken out on this home.
Original Mortgage
$191,569
Interest Rate
6.27%
Mortgage Type
Purchase Money Mortgage
Purchase Details
Closed on
Jun 9, 2005
Sold by
Dominion Homes Inc
Bought by
Gmac Model Home Finance Inc
Purchase Details
Closed on
Jun 8, 2005
Sold by
Cheshire Road Llc
Bought by
Dominion Homes Inc
Create a Home Valuation Report for This Property
The Home Valuation Report is an in-depth analysis detailing your home's value as well as a comparison with similar homes in the area
Home Values in the Area
Average Home Value in this Area
Purchase History
| Date | Buyer | Sale Price | Title Company |
|---|---|---|---|
| Bibler John C | $317,000 | Attorney | |
| Wosiak Thomas | $255,500 | Alliance Title | |
| Gmac Model Home Finance Inc | $222,700 | Alliance Title | |
| Dominion Homes Inc | -- | Transohio Title |
Source: Public Records
Mortgage History
| Date | Status | Borrower | Loan Amount |
|---|---|---|---|
| Open | Bibler John C | $327,461 | |
| Previous Owner | Wosiak Thomas | $63,856 | |
| Previous Owner | Wosiak Thomas | $191,569 |
Source: Public Records
Tax History Compared to Growth
Tax History
| Year | Tax Paid | Tax Assessment Tax Assessment Total Assessment is a certain percentage of the fair market value that is determined by local assessors to be the total taxable value of land and additions on the property. | Land | Improvement |
|---|---|---|---|---|
| 2024 | $7,518 | $152,430 | $27,300 | $125,130 |
| 2023 | $7,550 | $152,430 | $27,300 | $125,130 |
| 2022 | $7,167 | $115,120 | $19,250 | $95,870 |
| 2021 | $7,209 | $115,120 | $19,250 | $95,870 |
| 2020 | $7,243 | $115,120 | $19,250 | $95,870 |
| 2019 | $6,225 | $104,090 | $19,250 | $84,840 |
| 2018 | $6,254 | $104,090 | $19,250 | $84,840 |
| 2017 | $6,181 | $83,410 | $15,120 | $68,290 |
| 2016 | $5,320 | $83,410 | $15,120 | $68,290 |
| 2015 | $4,768 | $83,410 | $15,120 | $68,290 |
| 2014 | $4,838 | $83,410 | $15,120 | $68,290 |
| 2013 | $4,793 | $80,780 | $15,120 | $65,660 |
Source: Public Records
Map
Nearby Homes
- 101 Ruby Red Ln
- 106 Sapphire Ice Dr
- 90 Lakes at Cheshire Dr
- 34 Lakes at Cheshire Dr
- 80 Lakes at Cheshire Dr
- 64 Lakes at Cheshire Dr
- 953 Sapphire Flame Dr
- 261 Vista Ridge Dr
- 3434 Royal Dornoch Cir
- 278 Indigo Blue St
- 401 Cherry Leaf Rd
- 437 Braumiller Crossing Dr
- 404 Colony Ridge Dr
- 90 Stoneybank Dr
- 102 Stoneybank Dr Unit 15694, Developer lo
- 114 Stoneybank Dr Unit 15692 Developer Lot
- 643 Buena Park Dr
- 0 Olentangy River Rd Unit 218028010
- 784 Maketewah Dr
- 145 Glen Mawr Cir
- 176 Cheshire Crossing Dr
- 170 Cheshire Crossing Dr
- 171 Ruby Red Ln
- 171 Ruby Red Ln Unit 8860
- 168 Cheshire Crossing Dr
- 155 Ruby Red Ln
- 183 Cheshire Crossing Dr
- 177 Cheshire Crossing Dr
- 149 Ruby Red Ln
- 164 Cheshire Crossing Dr
- 164 Cheshire Crossing Dr Unit 8842
- 189 Cheshire Crossing Dr
- 189 Cheshire Crossing Dr Unit 8824
- 171 Cheshire Crossing Dr
- 171 Cheshire Crossing Dr Unit 8827
- 143 Ruby Red Ln
- 165 Cheshire Crossing Dr
- 158 Cheshire Crossing Dr
- 172 Ruby Red Ln
- 166 Ruby Red Ln