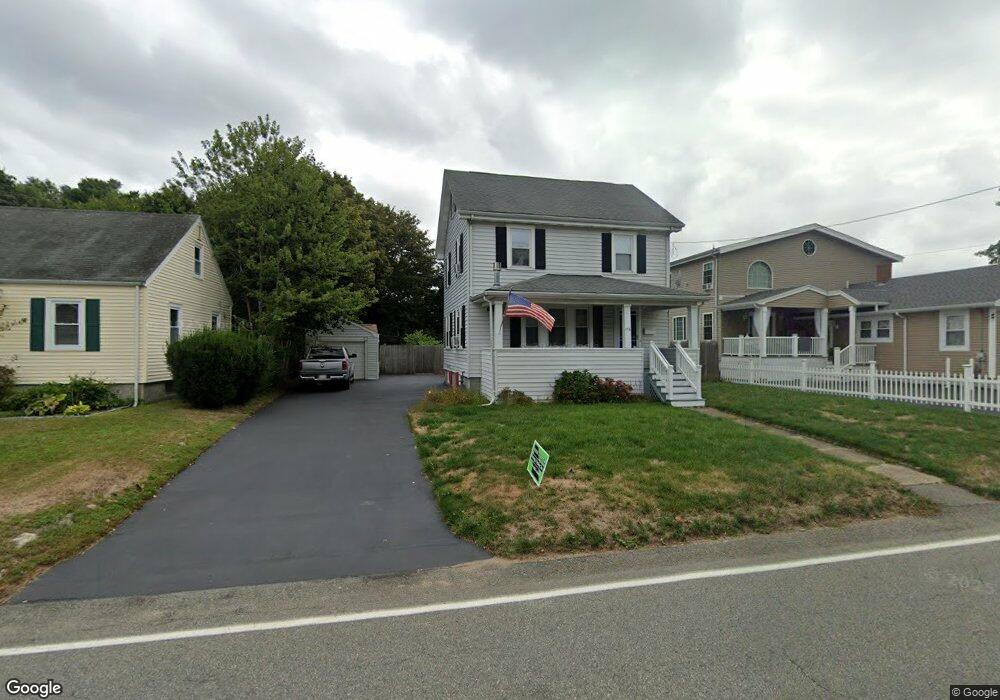
176 Chestnut St Randolph, MA 02368
North Randolph NeighborhoodEstimated Value: $539,623 - $600,000
4
Beds
1
Bath
1,230
Sq Ft
$459/Sq Ft
Est. Value
About This Home
This home is located at 176 Chestnut St, Randolph, MA 02368 and is currently estimated at $565,156, approximately $459 per square foot. 176 Chestnut St is a home located in Norfolk County with nearby schools including Randolph High School and Lighthouse Baptist Christian Academy.
Ownership History
Date
Name
Owned For
Owner Type
Purchase Details
Closed on
Nov 30, 2001
Sold by
Bessette Joseph A and Bessette Ann
Bought by
Sinclair Kimberly A
Current Estimated Value
Home Financials for this Owner
Home Financials are based on the most recent Mortgage that was taken out on this home.
Original Mortgage
$194,900
Outstanding Balance
$76,666
Interest Rate
6.66%
Mortgage Type
Purchase Money Mortgage
Estimated Equity
$488,490
Create a Home Valuation Report for This Property
The Home Valuation Report is an in-depth analysis detailing your home's value as well as a comparison with similar homes in the area
Home Values in the Area
Average Home Value in this Area
Purchase History
| Date | Buyer | Sale Price | Title Company |
|---|---|---|---|
| Sinclair Kimberly A | $244,900 | -- |
Source: Public Records
Mortgage History
| Date | Status | Borrower | Loan Amount |
|---|---|---|---|
| Open | Sinclair Kimberly A | $194,900 |
Source: Public Records
Tax History Compared to Growth
Tax History
| Year | Tax Paid | Tax Assessment Tax Assessment Total Assessment is a certain percentage of the fair market value that is determined by local assessors to be the total taxable value of land and additions on the property. | Land | Improvement |
|---|---|---|---|---|
| 2025 | $5,660 | $487,500 | $250,000 | $237,500 |
| 2024 | $5,550 | $484,700 | $245,100 | $239,600 |
| 2023 | $5,176 | $428,500 | $222,800 | $205,700 |
| 2022 | $5,029 | $369,800 | $185,700 | $184,100 |
| 2021 | $4,731 | $320,100 | $154,600 | $165,500 |
| 2020 | $4,779 | $320,500 | $154,600 | $165,900 |
| 2019 | $4,578 | $305,600 | $147,300 | $158,300 |
| 2018 | $4,324 | $272,300 | $133,900 | $138,400 |
| 2017 | $4,288 | $265,000 | $127,500 | $137,500 |
| 2016 | $4,142 | $238,200 | $115,900 | $122,300 |
| 2015 | $3,978 | $219,800 | $110,400 | $109,400 |
Source: Public Records
Map
Nearby Homes
- 229 Chestnut St
- 2 Smith Rd
- 16 Simmonds Blvd Unit 16
- 20 Simmonds Blvd Unit 20
- 14 Simmonds Blvd Unit 14
- 12 Simmonds Blvd Unit 12
- 12 Webster St
- 7 Webster St
- 34 Orchard St
- 43 Emily Jeffers Rd
- 33 Michael Rd
- 1 Clark Cir
- 591 N Main St
- 26 Knights Crescent St
- 11 Royal Crest Dr Unit 5
- 10 Michael Rd
- 9 Royal Crest Dr Unit 12
- 304 High St
- 79 Gold St
- 12 Jasper Ln Unit 12
- 180 Chestnut St
- 174 Chestnut St
- 182 Chestnut St
- 172 Chestnut St
- 4 Northway Rd
- 179 Chestnut St
- 6 Northway Rd
- 181 Chestnut St
- 1 Northway Rd
- 170 Chestnut St
- 175 Chestnut St
- 5 Lambert Rd
- 163 Chestnut St
- 186 Chestnut St
- 8 Northway Rd
- 4 Lambert Rd
- 167 Chestnut St
- 5 Northway Rd
- 185 Chestnut St
- 168 Chestnut St