Estimated Value: $313,000 - $348,851
3
Beds
2
Baths
1,193
Sq Ft
$272/Sq Ft
Est. Value
About This Home
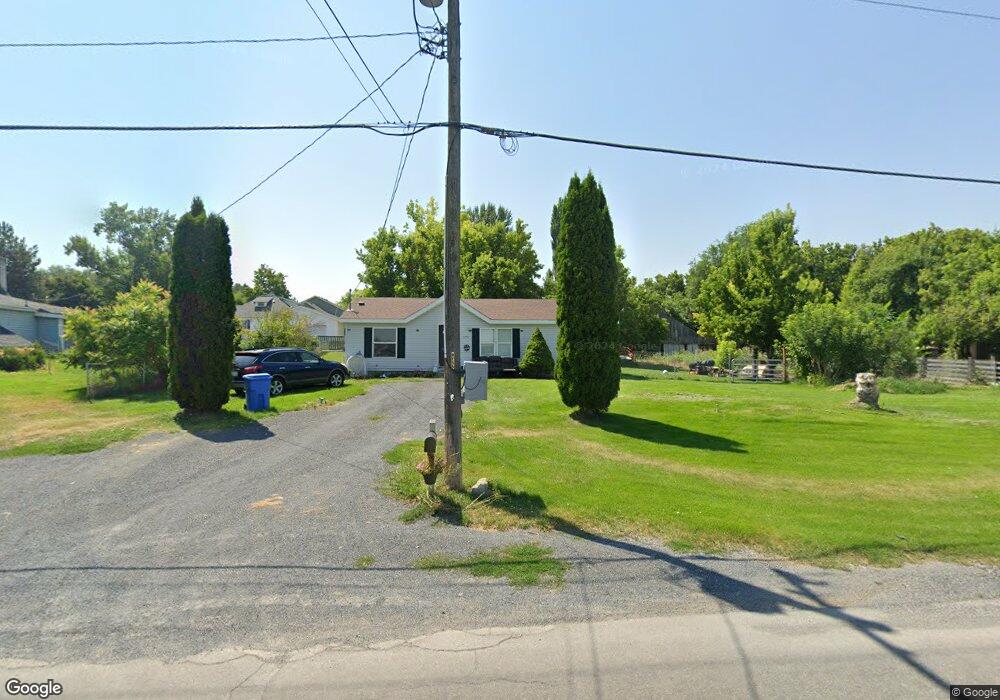
This home is located at 176 E 100 N, Hyrum, UT 84319 and is currently estimated at $323,963, approximately $271 per square foot. 176 E 100 N is a home located in Cache County with nearby schools including Lincoln School, South Cache Middle School, and Mountain Crest High School.
Ownership History
Date
Name
Owned For
Owner Type
Purchase Details
Closed on
Oct 17, 2023
Sold by
Kartchner Homes Inc
Bought by
Wild Alexander and Wild Emily
Current Estimated Value
Purchase Details
Closed on
Oct 23, 2014
Sold by
Arriola Marisol Patino
Bought by
Rodriguez Luzbaldo
Purchase Details
Closed on
Feb 25, 2005
Sold by
Ortiz Laura
Bought by
Rodriguez Lusbaldo and Arriola Marisol Patino
Home Financials for this Owner
Home Financials are based on the most recent Mortgage that was taken out on this home.
Original Mortgage
$99,114
Interest Rate
5.73%
Mortgage Type
FHA
Create a Home Valuation Report for This Property
The Home Valuation Report is an in-depth analysis detailing your home's value as well as a comparison with similar homes in the area
Home Values in the Area
Average Home Value in this Area
Purchase History
| Date | Buyer | Sale Price | Title Company |
|---|---|---|---|
| Wild Alexander | -- | Cache Title | |
| Rodriguez Luzbaldo | -- | None Available | |
| Rodriguez Lusbaldo | -- | Heritage West Title |
Source: Public Records
Mortgage History
| Date | Status | Borrower | Loan Amount |
|---|---|---|---|
| Previous Owner | Rodriguez Lusbaldo | $99,114 |
Source: Public Records
Tax History
| Year | Tax Paid | Tax Assessment Tax Assessment Total Assessment is a certain percentage of the fair market value that is determined by local assessors to be the total taxable value of land and additions on the property. | Land | Improvement |
|---|---|---|---|---|
| 2025 | $1,013 | $145,410 | $0 | $0 |
| 2023 | $914 | $117,135 | $0 | $0 |
| 2022 | $953 | $117,135 | $0 | $0 |
| 2021 | $969 | $183,385 | $65,050 | $118,335 |
| 2020 | $903 | $160,431 | $65,050 | $95,381 |
| 2019 | $808 | $134,941 | $39,560 | $95,381 |
| 2018 | $758 | $122,500 | $39,560 | $82,940 |
| 2017 | $754 | $63,230 | $0 | $0 |
| 2016 | $771 | $63,230 | $0 | $0 |
| 2015 | $729 | $59,585 | $0 | $0 |
| 2014 | $692 | $57,865 | $0 | $0 |
| 2013 | -- | $57,865 | $0 | $0 |
Source: Public Records
Map
Nearby Homes
Your Personal Tour Guide
Ask me questions while you tour the home.