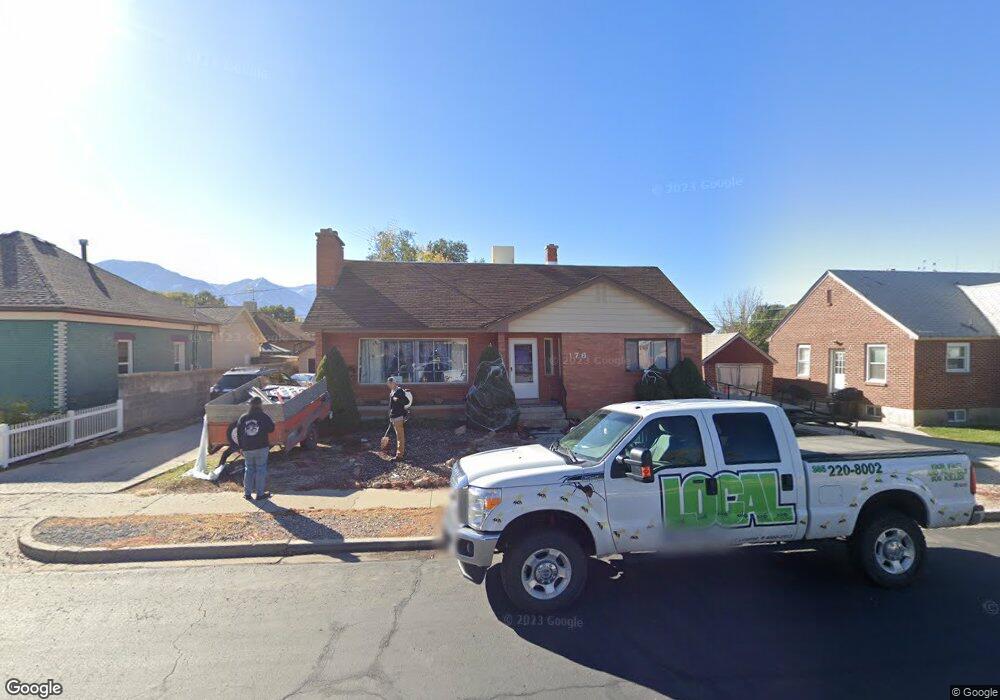
176 E 200 S Spanish Fork, UT 84660
Estimated Value: $471,000 - $495,976
4
Beds
2
Baths
2,695
Sq Ft
$180/Sq Ft
Est. Value
About This Home
This home is located at 176 E 200 S, Spanish Fork, UT 84660 and is currently estimated at $484,325, approximately $179 per square foot. 176 E 200 S is a home located in Utah County with nearby schools including Park Elementary School, Spanish Fork Jr High School, and Spanish Fork High School.
Ownership History
Date
Name
Owned For
Owner Type
Purchase Details
Closed on
Nov 27, 2017
Sold by
Smith Cody B and Smith Cameron E
Bought by
Castro Nicklas and Starley Sheena T
Current Estimated Value
Home Financials for this Owner
Home Financials are based on the most recent Mortgage that was taken out on this home.
Original Mortgage
$238,598
Outstanding Balance
$203,068
Interest Rate
4.37%
Mortgage Type
FHA
Estimated Equity
$281,258
Purchase Details
Closed on
Mar 17, 2003
Sold by
Bradford Lorraine
Bought by
Smith Cody B and Smith Cameron E
Home Financials for this Owner
Home Financials are based on the most recent Mortgage that was taken out on this home.
Original Mortgage
$127,006
Interest Rate
5.83%
Mortgage Type
FHA
Create a Home Valuation Report for This Property
The Home Valuation Report is an in-depth analysis detailing your home's value as well as a comparison with similar homes in the area
Home Values in the Area
Average Home Value in this Area
Purchase History
| Date | Buyer | Sale Price | Title Company |
|---|---|---|---|
| Castro Nicklas | -- | Inwest Title | |
| Smith Cody B | -- | Century Title |
Source: Public Records
Mortgage History
| Date | Status | Borrower | Loan Amount |
|---|---|---|---|
| Open | Castro Nicklas | $238,598 | |
| Previous Owner | Smith Cody B | $127,006 |
Source: Public Records
Tax History
| Year | Tax Paid | Tax Assessment Tax Assessment Total Assessment is a certain percentage of the fair market value that is determined by local assessors to be the total taxable value of land and additions on the property. | Land | Improvement |
|---|---|---|---|---|
| 2025 | $2,097 | $231,275 | -- | -- |
| 2024 | $2,097 | $216,150 | $0 | $0 |
| 2023 | $2,203 | $227,370 | $0 | $0 |
| 2022 | $2,150 | $217,635 | $0 | $0 |
| 2021 | $1,909 | $309,000 | $79,100 | $229,900 |
| 2020 | $1,734 | $273,000 | $65,900 | $207,100 |
| 2019 | $1,546 | $256,100 | $65,900 | $190,200 |
| 2018 | $1,445 | $231,300 | $65,900 | $165,400 |
| 2017 | $1,369 | $117,755 | $0 | $0 |
| 2016 | $1,227 | $104,170 | $0 | $0 |
| 2015 | $1,189 | $99,715 | $0 | $0 |
| 2014 | $1,123 | $94,545 | $0 | $0 |
Source: Public Records
Map
Nearby Homes
- 844 S 200 E Unit 4-304
- 844 S 200 E Unit 4 -201
- 390 S 300 E
- 298 S St Unit 205
- 296 S St Unit 20
- 324 S St Unit 204
- 573 E 300 S
- 284 N 400 E
- 2583 E 300 S Unit 21
- 134 W 700 S
- 721 S 110 W
- 270 N 500 E
- 733 S 170 W
- 837 S 200 E Unit 5-303
- 837 S 200 E Unit 5-201
- 837 S 200 E Unit 5-301
- 691 S 260 W
- 294 W 200 N
- 272 E 850 S Unit 7-204
- 272 E 850 S Unit 7-203
Your Personal Tour Guide
Ask me questions while you tour the home.