Estimated Value: $339,000 - $350,043
4
Beds
3
Baths
2,464
Sq Ft
$140/Sq Ft
Est. Value
About This Home
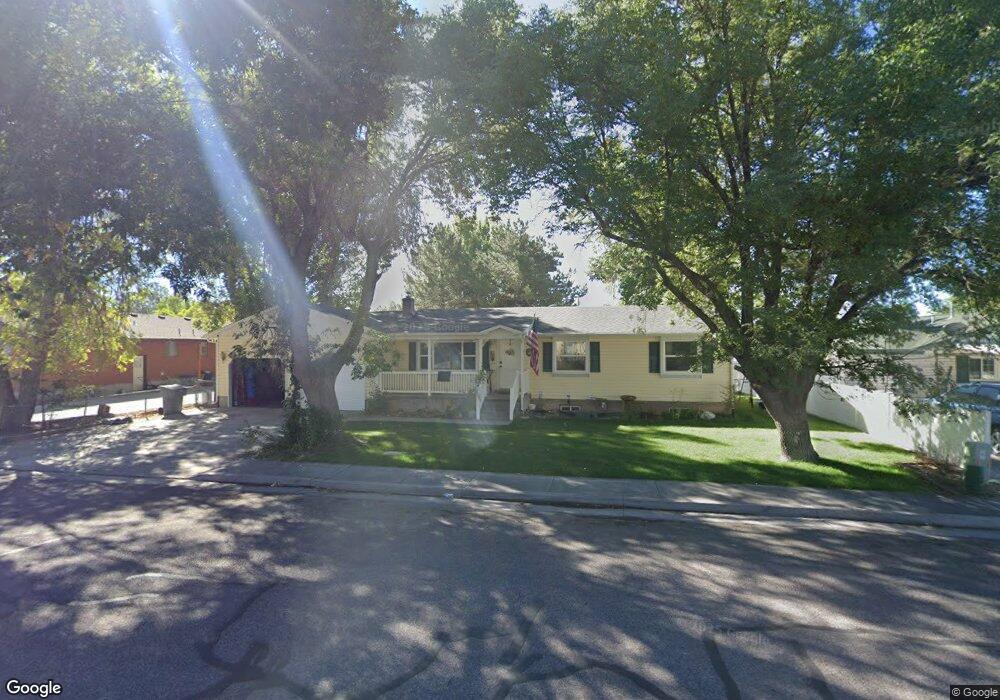
This home is located at 176 E 300 N, Delta, UT 84624 and is currently estimated at $346,011, approximately $140 per square foot. 176 E 300 N is a home with nearby schools including Cba Center and White River Academy.
Ownership History
Date
Name
Owned For
Owner Type
Purchase Details
Closed on
Jul 23, 2025
Sold by
Erwin John N and Erwin Heather L
Bought by
Nielson Drew and Nielson Paige
Current Estimated Value
Home Financials for this Owner
Home Financials are based on the most recent Mortgage that was taken out on this home.
Original Mortgage
$343,660
Outstanding Balance
$342,783
Interest Rate
6.84%
Mortgage Type
FHA
Estimated Equity
$3,228
Purchase Details
Closed on
Jan 26, 2016
Sold by
Gray James Preston
Bought by
Erwin John N and Erwin Heather L
Home Financials for this Owner
Home Financials are based on the most recent Mortgage that was taken out on this home.
Original Mortgage
$85,000
Interest Rate
3.92%
Mortgage Type
New Conventional
Purchase Details
Closed on
Dec 11, 2009
Sold by
Gray James R and Gray Reha M
Bought by
Gray James Preston
Home Financials for this Owner
Home Financials are based on the most recent Mortgage that was taken out on this home.
Original Mortgage
$76,000
Interest Rate
4.88%
Mortgage Type
New Conventional
Create a Home Valuation Report for This Property
The Home Valuation Report is an in-depth analysis detailing your home's value as well as a comparison with similar homes in the area
Home Values in the Area
Average Home Value in this Area
Purchase History
| Date | Buyer | Sale Price | Title Company |
|---|---|---|---|
| Nielson Drew | -- | First American Title Insurance | |
| Nielson Drew | -- | First American Title Insurance | |
| Erwin John N | -- | -- | |
| Gray James Preston | -- | -- |
Source: Public Records
Mortgage History
| Date | Status | Borrower | Loan Amount |
|---|---|---|---|
| Open | Nielson Drew | $343,660 | |
| Closed | Nielson Drew | $343,660 | |
| Previous Owner | Erwin John N | $85,000 | |
| Previous Owner | Gray James Preston | $76,000 |
Source: Public Records
Tax History Compared to Growth
Tax History
| Year | Tax Paid | Tax Assessment Tax Assessment Total Assessment is a certain percentage of the fair market value that is determined by local assessors to be the total taxable value of land and additions on the property. | Land | Improvement |
|---|---|---|---|---|
| 2025 | $1,477 | $157,829 | $15,208 | $142,621 |
| 2024 | $1,477 | $152,529 | $14,485 | $138,044 |
| 2023 | $1,908 | $152,529 | $14,485 | $138,044 |
| 2022 | $1,437 | $108,059 | $13,168 | $94,891 |
| 2021 | $1,238 | $88,912 | $11,450 | $77,462 |
| 2020 | $1,152 | $82,223 | $10,409 | $71,814 |
| 2019 | $1,054 | $75,271 | $10,106 | $65,165 |
| 2018 | $971 | $69,890 | $10,106 | $59,784 |
| 2017 | $1,008 | $69,890 | $10,106 | $59,784 |
| 2016 | $976 | $69,890 | $10,106 | $59,784 |
| 2015 | $976 | $69,890 | $10,106 | $59,784 |
| 2014 | -- | $67,509 | $10,106 | $57,403 |
| 2013 | -- | $67,509 | $10,106 | $57,403 |
Source: Public Records
Map
Nearby Homes
- 445 Topaz Blvd Unit 10
- 0 E Highway 6 Unit LotWP001 16586023
- 461 Topaz Blvd Unit 6
- 7900 E 250 Rd N
- 325 N 100 W
- 44 E 300 S
- 629 E Millard St
- 628 Sunset St
- 321 E 200 S
- 163 W 100 S
- 331 W 200 N
- 901 E 750 Rd N
- 38 E 300 S
- 32 E 300 S
- 328 S Center St
- 451 W 300 N
- Locust Ave Unit LotWP001
- 98 W 1000 N
- 665 Bristlecone Ln
- 435 W 100 S