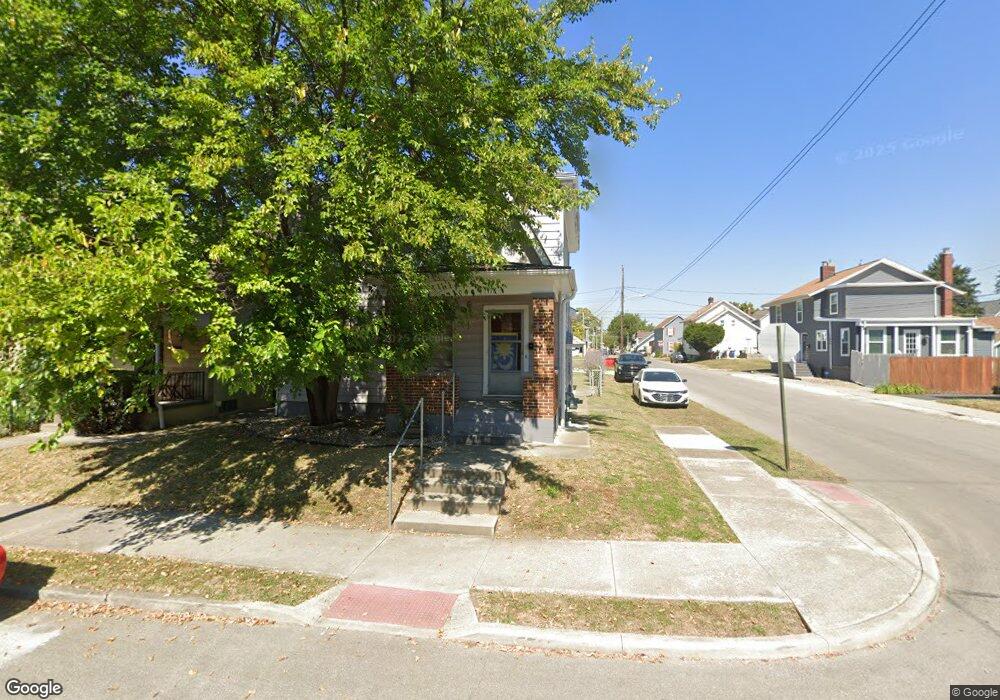
176 E Hinman Ave Columbus, OH 43207
Reeb-Hosack/Hungarian Village NeighborhoodEstimated Value: $240,130 - $278,000
3
Beds
2
Baths
1,602
Sq Ft
$164/Sq Ft
Est. Value
About This Home
This home is located at 176 E Hinman Ave, Columbus, OH 43207 and is currently estimated at $263,033, approximately $164 per square foot. 176 E Hinman Ave is a home located in Franklin County with nearby schools including Southwood Elementary School, South High School, and South Columbus Preparatory Academy.
Ownership History
Date
Name
Owned For
Owner Type
Purchase Details
Closed on
Jul 19, 1999
Sold by
Miller Eric D
Bought by
Miller Lisa Joann and Borror Joann
Current Estimated Value
Purchase Details
Closed on
Apr 2, 1990
Bought by
Miller Eric D
Purchase Details
Closed on
Oct 1, 1986
Purchase Details
Closed on
Jan 1, 1985
Create a Home Valuation Report for This Property
The Home Valuation Report is an in-depth analysis detailing your home's value as well as a comparison with similar homes in the area
Home Values in the Area
Average Home Value in this Area
Purchase History
| Date | Buyer | Sale Price | Title Company |
|---|---|---|---|
| Miller Lisa Joann | -- | -- | |
| Miller Eric D | $53,900 | -- | |
| -- | -- | -- | |
| -- | $46,700 | -- |
Source: Public Records
Tax History
| Year | Tax Paid | Tax Assessment Tax Assessment Total Assessment is a certain percentage of the fair market value that is determined by local assessors to be the total taxable value of land and additions on the property. | Land | Improvement |
|---|---|---|---|---|
| 2025 | $3,151 | $70,220 | $19,570 | $50,650 |
| 2024 | $3,151 | $70,220 | $19,570 | $50,650 |
| 2023 | $3,711 | $83,755 | $19,565 | $64,190 |
| 2022 | $2,662 | $51,320 | $11,450 | $39,870 |
| 2021 | $2,666 | $51,320 | $11,450 | $39,870 |
| 2020 | $2,670 | $51,320 | $11,450 | $39,870 |
| 2019 | $2,317 | $38,190 | $8,510 | $29,680 |
| 2018 | $1,999 | $38,190 | $8,510 | $29,680 |
| 2017 | $2,315 | $38,190 | $8,510 | $29,680 |
| 2016 | $1,857 | $28,040 | $5,810 | $22,230 |
| 2015 | $1,686 | $28,040 | $5,810 | $22,230 |
| 2014 | $1,690 | $28,040 | $5,810 | $22,230 |
| 2013 | $926 | $31,150 | $6,440 | $24,710 |
Source: Public Records
Map
Nearby Homes
- 149 E Hinman Ave
- 177 E Hinman Ave
- 1646 S 4th St Unit 648
- 172 E Woodrow Ave
- 130 E Woodrow Ave
- 148 E Welch Ave
- 1563 S 6th St
- 220 E Welch Ave
- 1583 S 4th St
- 236 E Welch Ave
- 1542 S 4th St Unit 1542
- 1543 S 4th St Unit 1543
- 218 E Markison Ave
- 1756 Bruck St
- 1624 S 8th St
- 92 E Innis Ave
- 284-286 E Markison Ave
- 332 E Hinman Ave
- 1808 S 6th St Unit 810
- 301 Southwood Ave
- 1657 S 6th St Unit TWENTY
- 172 E Hinman Ave
- 168 E Hinman Ave
- 1649 S 6th St Unit TWENTY
- 0 S 6th St
- 1654 S 6th St Unit TWENTY
- 1643 S 6th St Unit TWENTY
- 164 E Hinman Ave
- 190 E Hinman Ave
- 1656 S 6th St
- 1637 S 6th St Unit TWENTY
- 160 E Hinman Ave
- 1642 S 6th St Unit TWENTY
- 179 E Morrill Ave
- 1633 S 6th St Unit TWENTY
- 198 E Hinman Ave
- 1636 S 6th St Unit TWENTY
- 158 E Hinman Ave
- 158 E Hinman Ave
- 1627 S 6th St Unit TWENTY
Your Personal Tour Guide
Ask me questions while you tour the home.