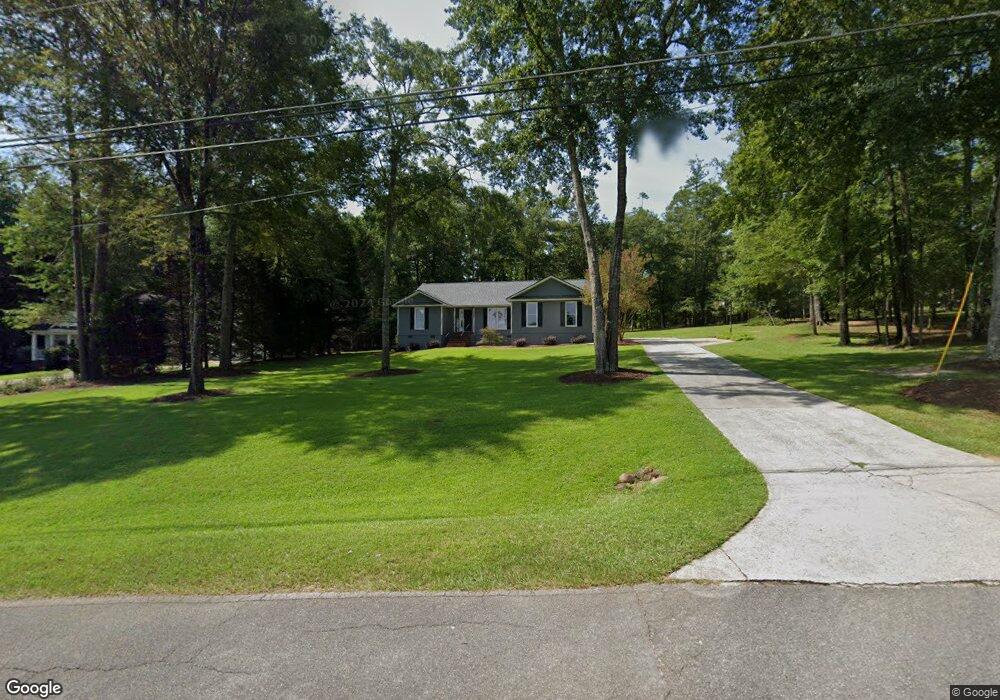
176 E Lakeview Dr NE Milledgeville, GA 31061
Estimated Value: $331,000 - $464,000
3
Beds
2
Baths
1,652
Sq Ft
$223/Sq Ft
Est. Value
About This Home
This home is located at 176 E Lakeview Dr NE, Milledgeville, GA 31061 and is currently estimated at $368,763, approximately $223 per square foot. 176 E Lakeview Dr NE is a home located in Baldwin County with nearby schools including Lakeview Primary, Lakeview Academy, and Oak Hill Middle School.
Ownership History
Date
Name
Owned For
Owner Type
Purchase Details
Closed on
Mar 25, 2013
Sold by
Bentley Matt H and Bentley Lacy C
Bought by
Bentley Matthew H and Bentley Lacy C
Current Estimated Value
Home Financials for this Owner
Home Financials are based on the most recent Mortgage that was taken out on this home.
Original Mortgage
$128,000
Outstanding Balance
$26,351
Interest Rate
3.57%
Mortgage Type
New Conventional
Estimated Equity
$342,412
Purchase Details
Closed on
Nov 30, 2004
Sold by
Martin Michael H and Martin T
Bought by
Bentley Matt H and Bentley Lacy C
Purchase Details
Closed on
Sep 24, 1999
Sold by
Green John and Green Shirley
Bought by
Martin Michael H and Martin T
Purchase Details
Closed on
Mar 25, 1998
Sold by
St John Mark & Nancy
Bought by
Green John
Purchase Details
Closed on
Feb 27, 1997
Sold by
Eady Danny
Bought by
St John Mark & Nancy
Purchase Details
Closed on
Feb 26, 1996
Sold by
Binion Richard
Bought by
Eady Danny
Create a Home Valuation Report for This Property
The Home Valuation Report is an in-depth analysis detailing your home's value as well as a comparison with similar homes in the area
Home Values in the Area
Average Home Value in this Area
Purchase History
| Date | Buyer | Sale Price | Title Company |
|---|---|---|---|
| Bentley Matthew H | -- | -- | |
| Bentley Matt H | $170,000 | -- | |
| Martin Michael H | $121,500 | -- | |
| Green John | $125,000 | -- | |
| St John Mark & Nancy | $122,500 | -- | |
| Eady Danny | $16,000 | -- |
Source: Public Records
Mortgage History
| Date | Status | Borrower | Loan Amount |
|---|---|---|---|
| Open | Bentley Matthew H | $128,000 |
Source: Public Records
Tax History Compared to Growth
Tax History
| Year | Tax Paid | Tax Assessment Tax Assessment Total Assessment is a certain percentage of the fair market value that is determined by local assessors to be the total taxable value of land and additions on the property. | Land | Improvement |
|---|---|---|---|---|
| 2025 | $2,473 | $101,468 | $14,400 | $87,068 |
| 2024 | $2,473 | $101,468 | $14,400 | $87,068 |
| 2023 | $1,899 | $77,912 | $12,000 | $65,912 |
| 2022 | $1,697 | $78,592 | $12,000 | $66,592 |
| 2021 | $1,385 | $62,720 | $12,000 | $50,720 |
| 2020 | $1,366 | $62,720 | $12,000 | $50,720 |
| 2019 | $1,368 | $62,720 | $12,000 | $50,720 |
| 2018 | $1,377 | $62,720 | $12,000 | $50,720 |
| 2017 | $1,395 | $64,720 | $14,000 | $50,720 |
| 2016 | $1,783 | $76,240 | $15,000 | $61,240 |
| 2015 | $1,786 | $75,480 | $15,000 | $60,480 |
| 2014 | $1,769 | $75,480 | $15,000 | $60,480 |
Source: Public Records
Map
Nearby Homes
- 185 E Lakeview Dr NE
- 191A E Lakeview Dr NE Unit B
- 191 E Lakeview Dr
- 410 High Bluff Ct NE
- 514 High Bluff Ct NE
- 116 Newport Rd NE
- 113 Island View Dr NE
- 123 S Emerald Way
- 103 Water Ridge Dr
- 236 Erin Shores Dr NE
- 236 Erin Shores Dr
- 205 Lakecrest Dr NE
- 211 Lakecrest Dr NE
- 105 Waterford Ct
- 109 Miller Ct
- 105 Miller Ct
- 111 Miller Ct
- 350 Log Cabin Rd NE
- 210 Erin Shores Dr
- 165 Log Cabin Rd NE
- 172 E Lakeview Dr NE
- 180 E Lakeview Dr NE
- 170 E Lakeview Dr NE
- 183 E Lakeview Dr NE Unit 12A
- 183 E Lakeview Dr NE
- 476 Quail Ridge Ct NE
- 166 E Lakeview Dr NE
- 173 E Lakeview Dr NE
- 563 High Bluff Ct
- 167 W Lakeview Dr NE
- 483 High Bluff Ct
- 167 E Lakeview Dr NE
- 491 Quail Ridge Ct NE Unit 54
- 406 Quail Ridge Ct
- 406 Quail Ridge Ct NE
- 406 Quail Rdige Ct
- 144 E Lakeview Dr NE
- 142 E Lakeview Dr NE
- 163 E Lakeview Dr NE
- 453 High Bluff Ct