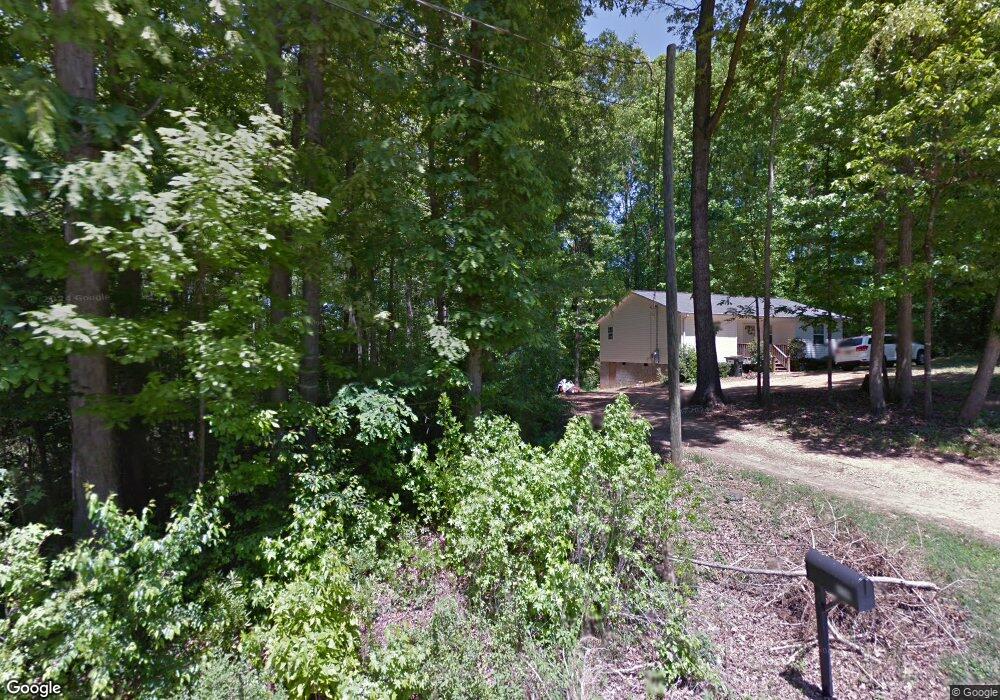
176 Forrest Dr Unit 43900 Lavonia, GA 30553
Estimated Value: $191,374 - $248,000
3
Beds
2
Baths
1,136
Sq Ft
$190/Sq Ft
Est. Value
About This Home
This home is located at 176 Forrest Dr Unit 43900, Lavonia, GA 30553 and is currently estimated at $215,344, approximately $189 per square foot. 176 Forrest Dr Unit 43900 is a home located in Franklin County with nearby schools including Franklin County High School.
Ownership History
Date
Name
Owned For
Owner Type
Purchase Details
Closed on
Dec 21, 2012
Sold by
Bank Of America
Bought by
Phillips Tim W and Phillips Cynthia
Current Estimated Value
Purchase Details
Closed on
Jul 3, 2012
Sold by
Cleveland Jeremy
Bought by
Bank Of America
Purchase Details
Closed on
Apr 26, 2007
Sold by
Howard Sandra G
Bought by
Cleveland Jeremy A
Home Financials for this Owner
Home Financials are based on the most recent Mortgage that was taken out on this home.
Original Mortgage
$96,390
Interest Rate
6.11%
Mortgage Type
New Conventional
Purchase Details
Closed on
Jul 10, 2006
Sold by
Hart Billy
Bought by
Howard Sandra G
Purchase Details
Closed on
Jul 21, 2005
Sold by
Maxwell Thomas
Bought by
Hart Billy
Purchase Details
Closed on
Mar 25, 1993
Bought by
Maxwell Thomas
Create a Home Valuation Report for This Property
The Home Valuation Report is an in-depth analysis detailing your home's value as well as a comparison with similar homes in the area
Home Values in the Area
Average Home Value in this Area
Purchase History
| Date | Buyer | Sale Price | Title Company |
|---|---|---|---|
| Phillips Tim W | $35,000 | -- | |
| Bank Of America | -- | -- | |
| Cleveland Jeremy A | $94,500 | -- | |
| Howard Sandra G | $80,000 | -- | |
| Hart Billy | $8,000 | -- | |
| Maxwell Thomas | $1,100 | -- |
Source: Public Records
Mortgage History
| Date | Status | Borrower | Loan Amount |
|---|---|---|---|
| Previous Owner | Cleveland Jeremy A | $96,390 |
Source: Public Records
Tax History Compared to Growth
Tax History
| Year | Tax Paid | Tax Assessment Tax Assessment Total Assessment is a certain percentage of the fair market value that is determined by local assessors to be the total taxable value of land and additions on the property. | Land | Improvement |
|---|---|---|---|---|
| 2024 | $997 | $41,894 | $2,100 | $39,794 |
| 2023 | $988 | $38,276 | $2,100 | $36,176 |
| 2022 | $903 | $34,993 | $2,100 | $32,893 |
| 2021 | $862 | $31,320 | $1,800 | $29,520 |
| 2020 | $871 | $31,320 | $1,800 | $29,520 |
| 2019 | $841 | $31,320 | $1,800 | $29,520 |
| 2018 | $734 | $27,334 | $1,800 | $25,534 |
| 2017 | $763 | $27,334 | $1,800 | $25,534 |
| 2016 | $713 | $24,442 | $1,800 | $22,642 |
| 2015 | -- | $24,441 | $1,800 | $22,642 |
| 2014 | -- | $24,442 | $1,800 | $22,642 |
| 2013 | -- | $29,112 | $2,400 | $26,712 |
Source: Public Records
Map
Nearby Homes
- 4094 Lankford Rd
- 4025 Lankford Rd
- 266 Randall St
- 86 Luckie St
- 0 Highway 59 Unit 10615036
- 353 Bow Dr
- 90 Old City Park Rd
- 5710 Vickery St
- 5494 Vickery St
- 5474 Vickery St
- 0 Hwy 59 and Ross Place Unit 10499138
- 103 Ross Place
- 89 Huntington Dr
- 138 Victoria Ln
- 49 Wright St Unit 65
- 45 Wright St Unit 64
- 57 Wright St Unit 68
- 55 Wright St Unit 67
- 51 Wright St Unit 66
- 59 Wright St Unit 69