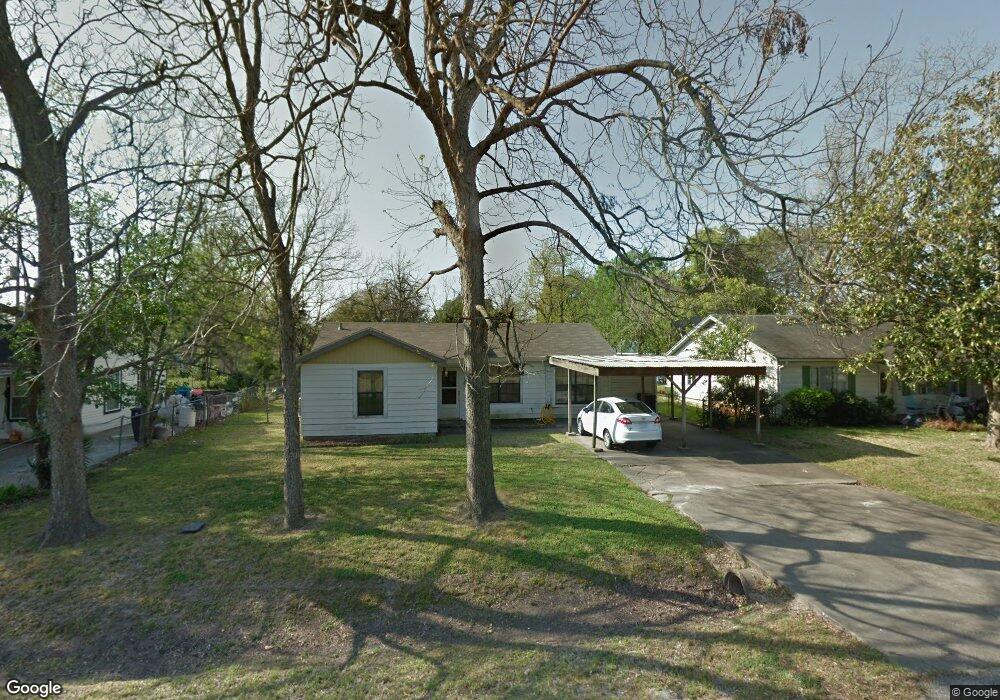
176 Hankla St Houston, TX 77076
Northside-Northline NeighborhoodEstimated Value: $202,827 - $286,000
2
Beds
1
Bath
1,590
Sq Ft
$145/Sq Ft
Est. Value
About This Home
This home is located at 176 Hankla St, Houston, TX 77076 and is currently estimated at $230,957, approximately $145 per square foot. 176 Hankla St is a home located in Harris County with nearby schools including Lyons Elementary School, Fonville Middle School, and Sam Houston Math, Science & Technology Center.
Ownership History
Date
Name
Owned For
Owner Type
Purchase Details
Closed on
Sep 14, 2022
Sold by
Hancock Doryce E
Bought by
Maldonado Celestino Carreon and Moreno Balvina Carreon
Current Estimated Value
Home Financials for this Owner
Home Financials are based on the most recent Mortgage that was taken out on this home.
Original Mortgage
$189,150
Outstanding Balance
$180,327
Interest Rate
4.99%
Mortgage Type
New Conventional
Estimated Equity
$50,630
Create a Home Valuation Report for This Property
The Home Valuation Report is an in-depth analysis detailing your home's value as well as a comparison with similar homes in the area
Home Values in the Area
Average Home Value in this Area
Purchase History
| Date | Buyer | Sale Price | Title Company |
|---|---|---|---|
| Maldonado Celestino Carreon | -- | -- |
Source: Public Records
Mortgage History
| Date | Status | Borrower | Loan Amount |
|---|---|---|---|
| Open | Maldonado Celestino Carreon | $189,150 | |
| Closed | Maldonado Celestino Carreon | $3,783 |
Source: Public Records
Tax History Compared to Growth
Tax History
| Year | Tax Paid | Tax Assessment Tax Assessment Total Assessment is a certain percentage of the fair market value that is determined by local assessors to be the total taxable value of land and additions on the property. | Land | Improvement |
|---|---|---|---|---|
| 2025 | $4,101 | $191,760 | $93,074 | $98,686 |
| 2024 | $4,101 | $195,990 | $93,074 | $102,916 |
| 2023 | $4,101 | $198,183 | $90,072 | $108,111 |
| 2022 | $2,675 | $157,957 | $70,056 | $87,901 |
| 2021 | $2,574 | $119,664 | $36,696 | $82,968 |
| 2020 | $2,432 | $113,627 | $36,696 | $76,931 |
| 2019 | $2,310 | $112,394 | $36,696 | $75,698 |
| 2018 | $221 | $82,990 | $26,688 | $56,302 |
| 2017 | $2,098 | $82,990 | $26,688 | $56,302 |
| 2016 | $1,989 | $78,644 | $26,688 | $51,956 |
| 2015 | $315 | $75,963 | $26,688 | $49,275 |
| 2014 | $315 | $75,963 | $26,688 | $49,275 |
Source: Public Records
Map
Nearby Homes
- 9816 Fulton St
- 9902 Clark Rd Unit D
- 9902 Clark Rd Unit I
- 9902 Clark Rd Unit G
- 9910 Fulton St
- 9711 Marydel St
- 110 Luetta St
- 108 Luetta St
- 106 Luetta St
- 104 Luetta St
- 9909 Dipping Woods St
- 9913 Dipping Woods St
- 9905 Fulton St
- 9925 Dipping Woods St
- 9916 Dipping Woods St
- 9920 Dipping Woods St
- 9905 Dipping Brook St
- 91 Burbank St
- 9907 Dipping Brook St
- 207 Dipping Stream St