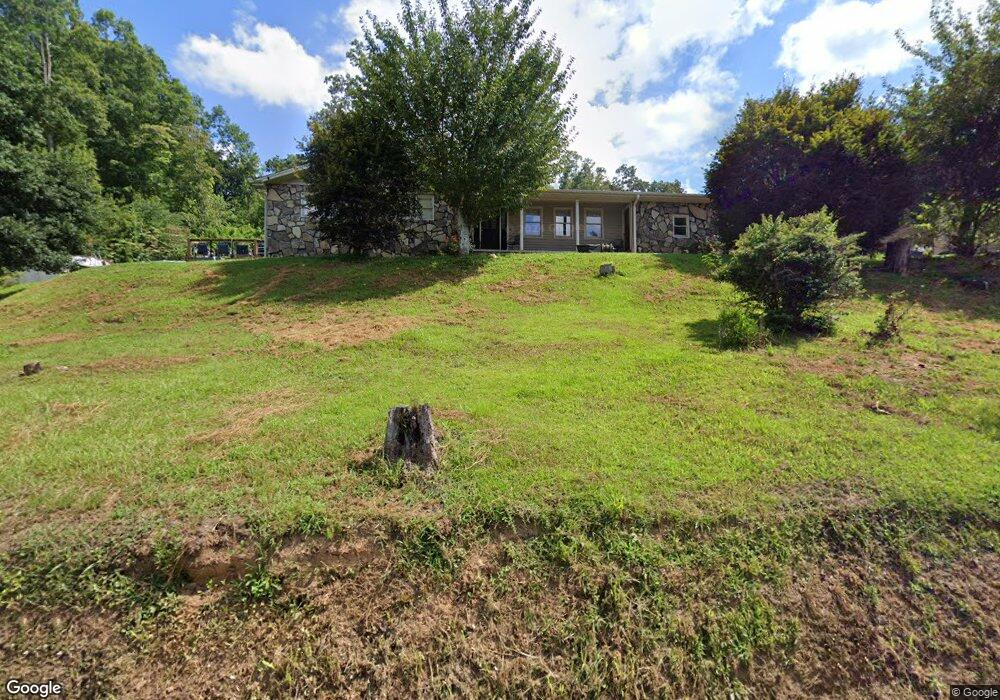
176 Harold Pritchett Rd Ellijay, GA 30540
Estimated Value: $356,000 - $443,000
2
Beds
2
Baths
1,640
Sq Ft
$248/Sq Ft
Est. Value
About This Home
This home is located at 176 Harold Pritchett Rd, Ellijay, GA 30540 and is currently estimated at $406,976, approximately $248 per square foot. 176 Harold Pritchett Rd is a home located in Gilmer County with nearby schools including Mountain View Elementary School, Gilmer Middle School, and Clear Creek Middle School.
Ownership History
Date
Name
Owned For
Owner Type
Purchase Details
Closed on
Dec 16, 2021
Sold by
Torres Bernabe Vasquez
Bought by
Torres Bernabe Vasquez and Vasquez Melissa L
Current Estimated Value
Home Financials for this Owner
Home Financials are based on the most recent Mortgage that was taken out on this home.
Original Mortgage
$288,868
Outstanding Balance
$265,683
Interest Rate
3.11%
Mortgage Type
FHA
Estimated Equity
$141,293
Purchase Details
Closed on
Nov 4, 2015
Sold by
Gudjob Llc
Bought by
Vasquez Melissa L
Home Financials for this Owner
Home Financials are based on the most recent Mortgage that was taken out on this home.
Original Mortgage
$126,272
Interest Rate
3.78%
Mortgage Type
New Conventional
Purchase Details
Closed on
Dec 6, 2012
Sold by
Key Randall M
Bought by
Gudjob Llc
Purchase Details
Closed on
Oct 14, 2011
Sold by
Key Helen J May
Bought by
Key Randall M
Create a Home Valuation Report for This Property
The Home Valuation Report is an in-depth analysis detailing your home's value as well as a comparison with similar homes in the area
Home Values in the Area
Average Home Value in this Area
Purchase History
| Date | Buyer | Sale Price | Title Company |
|---|---|---|---|
| Torres Bernabe Vasquez | -- | -- | |
| Torres Bernabe Vasquez | $334,000 | -- | |
| Vasquez Melissa L | $122,800 | -- | |
| Key Randall Maurice | -- | -- | |
| Key Randall Maurice | -- | -- | |
| Gudjob Llc | -- | -- | |
| Key Randall M | -- | -- |
Source: Public Records
Mortgage History
| Date | Status | Borrower | Loan Amount |
|---|---|---|---|
| Open | Torres Bernabe Vasquez | $288,868 | |
| Previous Owner | Key Randall Maurice | $126,272 |
Source: Public Records
Tax History Compared to Growth
Tax History
| Year | Tax Paid | Tax Assessment Tax Assessment Total Assessment is a certain percentage of the fair market value that is determined by local assessors to be the total taxable value of land and additions on the property. | Land | Improvement |
|---|---|---|---|---|
| 2024 | $1,739 | $140,656 | $38,560 | $102,096 |
| 2023 | $1,779 | $138,816 | $36,720 | $102,096 |
| 2022 | $1,743 | $118,696 | $36,720 | $81,976 |
| 2021 | $1,513 | $82,456 | $17,760 | $64,696 |
| 2020 | $1,492 | $69,724 | $17,320 | $52,404 |
| 2019 | $1,537 | $69,724 | $17,320 | $52,404 |
| 2018 | $1,595 | $69,520 | $17,320 | $52,200 |
| 2017 | $1,452 | $59,000 | $17,320 | $41,680 |
| 2016 | $1,494 | $59,520 | $17,320 | $42,200 |
| 2015 | $1,387 | $56,260 | $24,000 | $32,260 |
| 2014 | $1,433 | $55,940 | $24,000 | $31,940 |
| 2013 | -- | $57,740 | $24,000 | $33,740 |
Source: Public Records
Map
Nearby Homes
- 0 Walhalla Lot 387 Ct Unit 6109499
- 0 Reece Mountain Rd Unit 7663580
- 0 Reece Mountain Rd Unit 10622182
- LT 17R Tanager Trail
- 0 High River Rd Unit 419208
- 0 High River Rd Unit 7651483
- 0 High River Rd Unit 10608415
- 0 N Harris Creek Dr Unit 10590397
- 0 N Harris Creek Dr Unit 7637623
- 0 Flagpole Cir Unit 417397
- 0 Flagpole Cir Unit 10568056
- 10323 Grassy Mountain Rd
- 0 High River Rd Unit 10543629
- 0 High River Rd Unit 7597383
- 0 Flat Ridge Rd Unit 10490565
- 0 Flat Ridge Rd Unit 7551341
- 0 Abbey Ct Unit 412984
- 0 Carters View Dr Unit 10447445
- 00 Hwy 515
- 0 Flagpole Cir Unit 10319609
- 0 Carlisle Dr Unit 3034 8462030
- 0 Parkside Ct Unit 6079139
- 0 Lake Vista Ct Unit 6078889
- 0 Andes Ridge Unit 6078886
- 0 Andes Ridge Unit 6078878
- 400 Oakland Ct
- parcel 307 Highway 515
- 0 Andes Ridge Unit 8456725
- 2511 Litmus Ct Unit Lt 2511
- lot 271 Stone Cliff Dr
- LT500 Villa Dr
- 63.96AC Dotson Rd
- LL315 Old Burnt Mt Rd
- 000 Dragon Trail
- TR 1 Eller Rd
- 0 Tails Crk Church Rd Unit 6066497
- 0 Amy Creek Unit 17B 8440841
- LT17B Amy Creek
- 1102 Maggie Chapman
- 224 Andes Ridge