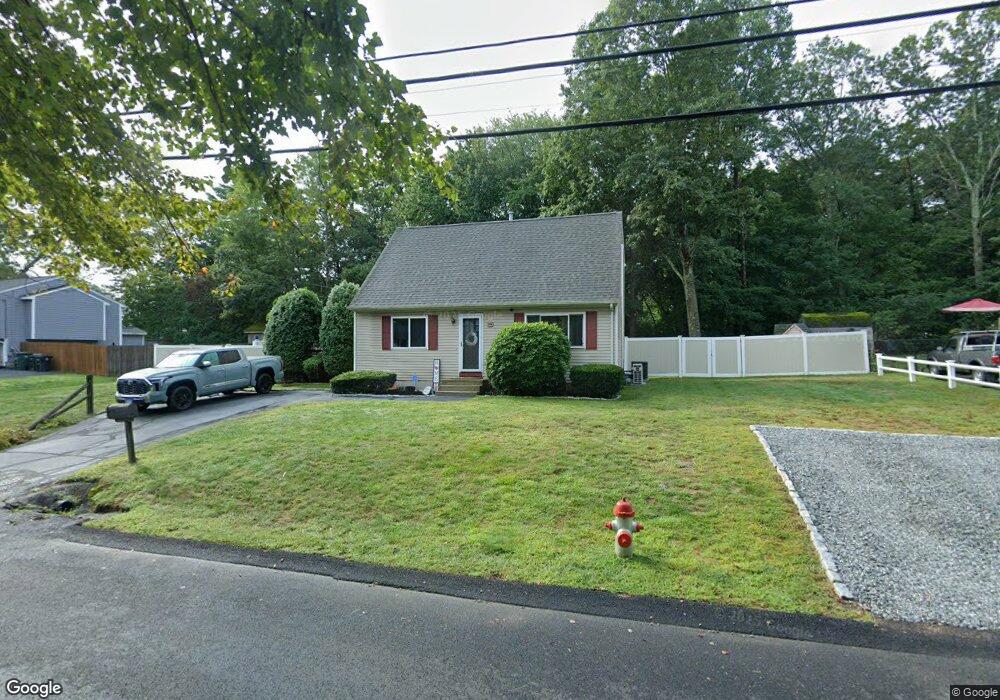
176 Howard Ave Coventry, RI 02816
Estimated Value: $426,334 - $517,000
3
Beds
2
Baths
1,344
Sq Ft
$343/Sq Ft
Est. Value
About This Home
This home is located at 176 Howard Ave, Coventry, RI 02816 and is currently estimated at $460,334, approximately $342 per square foot. 176 Howard Ave is a home located in Kent County with nearby schools including Alan Shawn Feinstein Ms Of Cov, Coventry High School, and St Joseph School.
Ownership History
Date
Name
Owned For
Owner Type
Purchase Details
Closed on
Mar 15, 2011
Sold by
Hedenberg Catherine J
Bought by
Casale Heather L and Casale Michael E
Current Estimated Value
Home Financials for this Owner
Home Financials are based on the most recent Mortgage that was taken out on this home.
Original Mortgage
$178,505
Outstanding Balance
$122,882
Interest Rate
4.83%
Mortgage Type
Purchase Money Mortgage
Estimated Equity
$337,452
Purchase Details
Closed on
Dec 1, 1998
Sold by
Medeiros Brian D and Medeiros Heather E
Bought by
Hedenberg Catherine J
Purchase Details
Closed on
Jul 31, 1997
Sold by
Lacroix Michael E and Lacroix Lori
Bought by
Medeiros Brian D and Medeiros Heather
Purchase Details
Closed on
Feb 3, 1992
Sold by
A & R Prop
Bought by
Lacroix Michael
Create a Home Valuation Report for This Property
The Home Valuation Report is an in-depth analysis detailing your home's value as well as a comparison with similar homes in the area
Purchase History
| Date | Buyer | Sale Price | Title Company |
|---|---|---|---|
| Casale Heather L | $187,900 | -- | |
| Hedenberg Catherine J | $115,000 | -- | |
| Medeiros Brian D | $112,000 | -- | |
| Lacroix Michael | $106,000 | -- |
Source: Public Records
Mortgage History
| Date | Status | Borrower | Loan Amount |
|---|---|---|---|
| Closed | Lacroix Michael | $41,000 | |
| Closed | Lacroix Michael | $2,000 | |
| Open | Lacroix Michael | $178,505 |
Source: Public Records
Tax History Compared to Growth
Tax History
| Year | Tax Paid | Tax Assessment Tax Assessment Total Assessment is a certain percentage of the fair market value that is determined by local assessors to be the total taxable value of land and additions on the property. | Land | Improvement |
|---|---|---|---|---|
| 2024 | $5,210 | $328,900 | $103,500 | $225,400 |
| 2023 | $5,042 | $328,900 | $103,500 | $225,400 |
| 2022 | $4,832 | $246,900 | $101,200 | $145,700 |
| 2021 | $4,790 | $246,900 | $101,200 | $145,700 |
| 2020 | $5,491 | $246,900 | $101,200 | $145,700 |
| 2019 | $4,713 | $211,900 | $77,100 | $134,800 |
| 2018 | $4,579 | $211,900 | $77,100 | $134,800 |
| 2017 | $4,446 | $211,900 | $77,100 | $134,800 |
| 2016 | $4,068 | $190,000 | $75,800 | $114,200 |
| 2015 | $3,958 | $190,000 | $75,800 | $114,200 |
| 2014 | $3,749 | $190,000 | $75,800 | $114,200 |
| 2013 | $3,986 | $213,600 | $101,600 | $112,000 |
Source: Public Records
Map
Nearby Homes