Estimated Value: $373,000 - $425,000
4
Beds
3
Baths
2,231
Sq Ft
$182/Sq Ft
Est. Value
About This Home
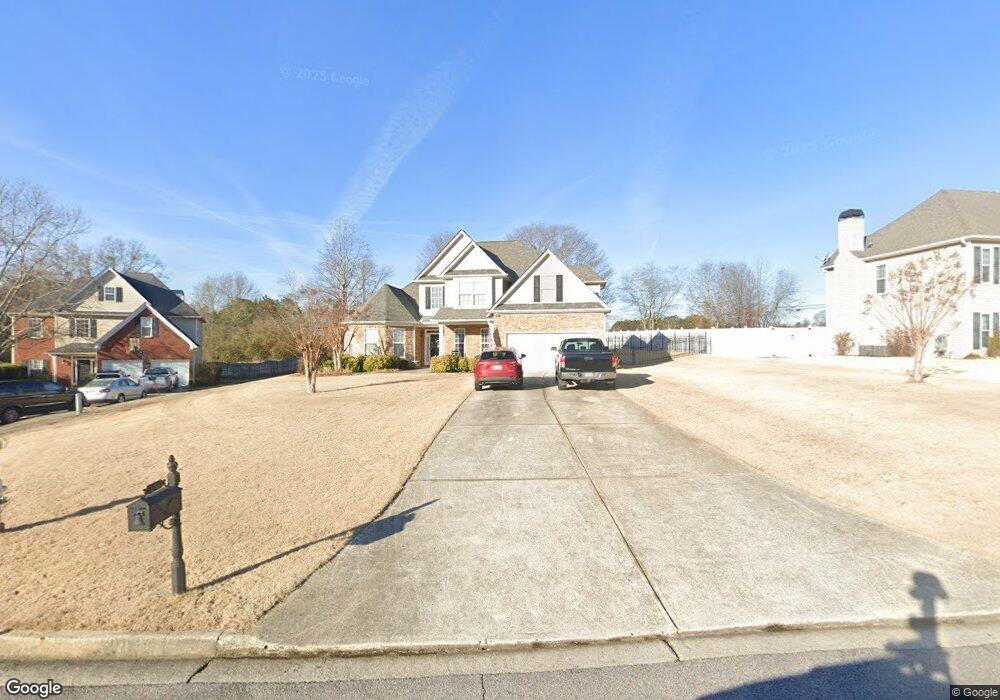
This home is located at 176 Inverness Way, Hiram, GA 30141 and is currently estimated at $406,687, approximately $182 per square foot. 176 Inverness Way is a home located in Paulding County with nearby schools including Nebo Elementary School, South Paulding Middle School, and South Paulding High School.
Ownership History
Date
Name
Owned For
Owner Type
Purchase Details
Closed on
Sep 23, 2015
Sold by
Singleton Victoria Michelle
Bought by
Singleton Christopher Andrew
Current Estimated Value
Purchase Details
Closed on
Dec 4, 2014
Sold by
Singleton Christopher Andrew
Bought by
Singleton Victoria Michelle
Purchase Details
Closed on
May 9, 2011
Sold by
Singleton Angela G and Singleton Christopher A
Bought by
Singleton Christopher A
Purchase Details
Closed on
Jun 3, 2003
Sold by
Wysocki Brothers Construction Co
Bought by
Singleton Christopher A
Home Financials for this Owner
Home Financials are based on the most recent Mortgage that was taken out on this home.
Original Mortgage
$192,850
Interest Rate
5.79%
Mortgage Type
New Conventional
Create a Home Valuation Report for This Property
The Home Valuation Report is an in-depth analysis detailing your home's value as well as a comparison with similar homes in the area
Home Values in the Area
Average Home Value in this Area
Purchase History
| Date | Buyer | Sale Price | Title Company |
|---|---|---|---|
| Singleton Christopher Andrew | -- | -- | |
| Singleton Victoria Michelle | -- | -- | |
| Singleton Christopher A | -- | -- | |
| Singleton Christopher A | $203,000 | -- |
Source: Public Records
Mortgage History
| Date | Status | Borrower | Loan Amount |
|---|---|---|---|
| Previous Owner | Singleton Christopher A | $192,850 |
Source: Public Records
Tax History Compared to Growth
Tax History
| Year | Tax Paid | Tax Assessment Tax Assessment Total Assessment is a certain percentage of the fair market value that is determined by local assessors to be the total taxable value of land and additions on the property. | Land | Improvement |
|---|---|---|---|---|
| 2024 | $4,138 | $169,600 | $14,000 | $155,600 |
| 2023 | $4,629 | $180,076 | $14,000 | $166,076 |
| 2022 | $3,821 | $148,444 | $14,000 | $134,444 |
| 2021 | $3,425 | $119,724 | $14,000 | $105,724 |
| 2020 | $2,987 | $102,436 | $14,000 | $88,436 |
| 2019 | $3,038 | $102,680 | $14,000 | $88,680 |
| 2018 | $2,753 | $93,252 | $14,000 | $79,252 |
| 2017 | $2,698 | $90,192 | $14,000 | $76,192 |
| 2016 | $2,396 | $81,108 | $14,000 | $67,108 |
| 2015 | $2,536 | $82,400 | $14,000 | $68,400 |
| 2014 | $2,314 | $75,160 | $14,000 | $61,160 |
| 2013 | -- | $61,560 | $14,000 | $47,560 |
Source: Public Records
Map
Nearby Homes
- Wyatt Plan at Savannah Lakes - Lochmoor at Savannah Lakes
- Blair Plan at Savannah Lakes - Lochmoor at Savannah Lakes
- Camden Plan at Savannah Lakes - Designer Collection
- Emmett Plan at Savannah Lakes - Lochmoor at Savannah Lakes
- Charles Plan at Savannah Lakes - Lochmoor at Savannah Lakes
- Avery Plan at Savannah Lakes - Lochmoor at Savannah Lakes
- Calvin Plan at Savannah Lakes - Lochmoor at Savannah Lakes
- Morgan Plan at Savannah Lakes - Designer Collection
- Maxwell Plan at Savannah Lakes - Designer Collection
- Edenton Plan at Savannah Lakes - Designer Collection
- Carrington Plan at Savannah Lakes - Lochmoor at Savannah Lakes
- Grandin Plan at Savannah Lakes - Lochmoor at Savannah Lakes
- Linden Plan at Savannah Lakes - Lochmoor at Savannah Lakes
- Amelia Plan at Savannah Lakes - Designer Collection
- Wilmington Plan at Savannah Lakes - Designer Collection
- Ivy Plan at Savannah Lakes - Lochmoor at Savannah Lakes
- 14 Calla Dr
- 48 Calla Dr
- 105 Pine Valley Ct Unit 1
- 71 Calla Dr
- 152 Inverness Way
- 190 Inverness Way
- 2417 Dallas Nebo Rd
- 126 Inverness Way
- 26 Inverness Place
- 194 Inverness Way
- 2521 Dallas Nebo Rd
- 171 Inverness Way
- 191 Inverness Way
- 193 Inverness Way
- 149 Inverness Way
- 129 Inverness Way
- 27 Inverness Place
- 117 Inverness Way
- 2 Inverness Way
- 74 Inverness Way
- 0000 Dallas Nebo Rd
- 32 Inverness Ct
- 2428 Dallas Nebo Rd Unit 38554065
- 0 Dallas Nebo Rd Unit LotWP001 19588961