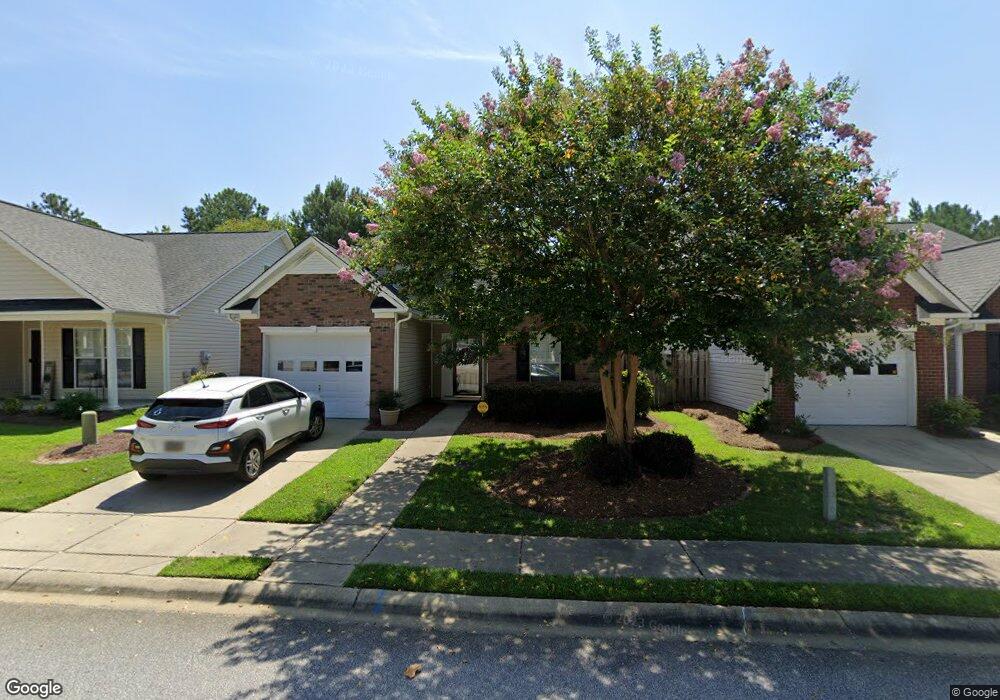
176 Ivy Square Dr Columbia, SC 29229
Estimated Value: $217,000 - $237,000
3
Beds
2
Baths
1,290
Sq Ft
$174/Sq Ft
Est. Value
About This Home
This home is located at 176 Ivy Square Dr, Columbia, SC 29229 and is currently estimated at $224,316, approximately $173 per square foot. 176 Ivy Square Dr is a home located in Richland County with nearby schools including Sandlapper Elementary School, Longleaf Middle School, and Westwood High School.
Ownership History
Date
Name
Owned For
Owner Type
Purchase Details
Closed on
May 6, 2019
Sold by
Atkinson Roger H and Atkinson Margie B
Bought by
Hunsicker Andrew R
Current Estimated Value
Home Financials for this Owner
Home Financials are based on the most recent Mortgage that was taken out on this home.
Original Mortgage
$136,383
Outstanding Balance
$120,904
Interest Rate
4.62%
Mortgage Type
FHA
Estimated Equity
$103,412
Purchase Details
Closed on
Sep 29, 2016
Sold by
Poole Daniel W
Bought by
Atkinson Roger H and Atkinson Margie B
Home Financials for this Owner
Home Financials are based on the most recent Mortgage that was taken out on this home.
Original Mortgage
$119,047
Interest Rate
3.62%
Mortgage Type
FHA
Purchase Details
Closed on
Jun 26, 2006
Sold by
Mungo Homes Inc
Bought by
Poole Daniel W
Home Financials for this Owner
Home Financials are based on the most recent Mortgage that was taken out on this home.
Original Mortgage
$30,000,000
Interest Rate
6.6%
Mortgage Type
Unknown
Create a Home Valuation Report for This Property
The Home Valuation Report is an in-depth analysis detailing your home's value as well as a comparison with similar homes in the area
Home Values in the Area
Average Home Value in this Area
Purchase History
| Date | Buyer | Sale Price | Title Company |
|---|---|---|---|
| Hunsicker Andrew R | $138,900 | None Available | |
| Atkinson Roger H | $126,000 | None Available | |
| Poole Daniel W | $129,248 | None Available | |
| Mungo Homes Inc | $18,000 | None Available |
Source: Public Records
Mortgage History
| Date | Status | Borrower | Loan Amount |
|---|---|---|---|
| Open | Hunsicker Andrew R | $136,383 | |
| Previous Owner | Atkinson Roger H | $119,047 | |
| Previous Owner | Mungo Homes Inc | $30,000,000 | |
| Previous Owner | Poole Daniel W | $103,350 |
Source: Public Records
Tax History Compared to Growth
Tax History
| Year | Tax Paid | Tax Assessment Tax Assessment Total Assessment is a certain percentage of the fair market value that is determined by local assessors to be the total taxable value of land and additions on the property. | Land | Improvement |
|---|---|---|---|---|
| 2024 | $1,655 | $159,700 | $0 | $0 |
| 2023 | $1,655 | $5,556 | $0 | $0 |
| 2022 | $1,487 | $138,900 | $20,000 | $118,900 |
| 2021 | $1,488 | $5,560 | $0 | $0 |
| 2020 | $4,961 | $8,330 | $0 | $0 |
| 2019 | $821 | $4,480 | $0 | $0 |
| 2018 | $923 | $5,040 | $0 | $0 |
| 2017 | $908 | $5,040 | $0 | $0 |
| 2016 | $1,156 | $4,200 | $0 | $0 |
| 2015 | $3,599 | $6,290 | $0 | $0 |
| 2014 | $3,555 | $104,900 | $0 | $0 |
| 2013 | -- | $6,290 | $0 | $0 |
Source: Public Records
Map
Nearby Homes
- 524 Gilden Hawke Way
- 306 Golden Ingot Ln
- 170 Rivendale Dr
- 36 Robins Egg Ct
- 245 Cogburn Rd
- 339 Cornflower Dr
- 106 Fallstaff Rd
- 102 Fallstaff Rd
- 383 Westmoreland Rd
- 312 Baccharis Dr
- 633 Chaterelle Way
- 207 Big Game Loop
- 140 Longtown Place Dr
- 190 Big Game Loop
- 711 Longtown
- 290 Traditions Cir Unit 1
- 430 Royal Links Dr
- 416 Gingerbread Ct N
- 925 Corison Loop
- 10510 Farrow Rd
- 172 Ivy Square Dr
- 180 Ivy Square Dr
- 184 Ivy Square Dr
- 177 Ivy Square Dr
- 181 Ivy Square Dr
- 188 Ivy Square Dr
- 185 Ivy Square Dr
- 185 Ivy Square Dr Unit 78
- 164 Ivy Square Dr
- 160 Ivy Square Dr
- 189 Ivy Square Dr
- 156 Ivy Square Dr
- 152 Ivy Square Dr
- 892 Sandmyrtle Cir
- 888 Sandmyrtle Cir
- 800 Sandmyrtle Cir
- 884 Sandmyrtle Cir
- 215 Ivy Square Dr
- 211 Ivy Square Dr
- 622 Teardrop Ln