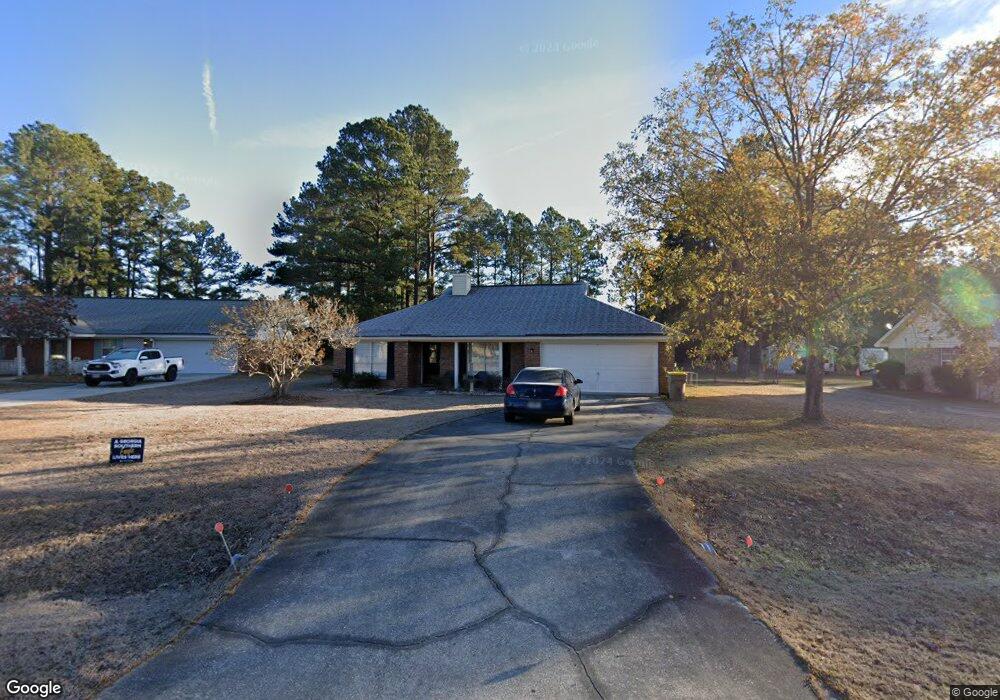
176 Jennifer Cir Unit 127 Rincon, GA 31326
Estimated Value: $307,000 - $338,000
3
Beds
2
Baths
1,729
Sq Ft
$186/Sq Ft
Est. Value
About This Home
This home is located at 176 Jennifer Cir Unit 127, Rincon, GA 31326 and is currently estimated at $320,860, approximately $185 per square foot. 176 Jennifer Cir Unit 127 is a home located in Effingham County with nearby schools including South Effingham Elementary School, South Effingham Middle School, and South Effingham High School.
Ownership History
Date
Name
Owned For
Owner Type
Purchase Details
Closed on
Feb 28, 2020
Sold by
Doerr Jeremy A
Bought by
Pluff Andrea K
Current Estimated Value
Home Financials for this Owner
Home Financials are based on the most recent Mortgage that was taken out on this home.
Original Mortgage
$192,449
Outstanding Balance
$170,763
Interest Rate
3.6%
Mortgage Type
FHA
Estimated Equity
$150,097
Purchase Details
Closed on
Aug 28, 2018
Sold by
Doerr Jeremy A
Bought by
Doerr Jeremy A and Doerr Laura A
Purchase Details
Closed on
Dec 22, 2014
Sold by
Brennan Peter A
Bought by
Doerr Jeremy A
Home Financials for this Owner
Home Financials are based on the most recent Mortgage that was taken out on this home.
Original Mortgage
$142,766
Interest Rate
4.03%
Mortgage Type
FHA
Purchase Details
Closed on
Jan 2, 2007
Sold by
Brennan Peter A
Bought by
Brennan Peter A and Brennan Anna G
Create a Home Valuation Report for This Property
The Home Valuation Report is an in-depth analysis detailing your home's value as well as a comparison with similar homes in the area
Home Values in the Area
Average Home Value in this Area
Purchase History
| Date | Buyer | Sale Price | Title Company |
|---|---|---|---|
| Pluff Andrea K | $196,000 | -- | |
| Doerr Jeremy A | -- | -- | |
| Doerr Jeremy A | $145,400 | -- | |
| Brennan Peter A | -- | -- |
Source: Public Records
Mortgage History
| Date | Status | Borrower | Loan Amount |
|---|---|---|---|
| Open | Pluff Andrea K | $192,449 | |
| Previous Owner | Doerr Jeremy A | $142,766 |
Source: Public Records
Tax History Compared to Growth
Tax History
| Year | Tax Paid | Tax Assessment Tax Assessment Total Assessment is a certain percentage of the fair market value that is determined by local assessors to be the total taxable value of land and additions on the property. | Land | Improvement |
|---|---|---|---|---|
| 2024 | $3,806 | $114,176 | $22,800 | $91,376 |
| 2023 | $2,900 | $95,046 | $18,800 | $76,246 |
| 2022 | $2,322 | $73,384 | $14,000 | $59,384 |
| 2021 | $2,264 | $69,465 | $14,000 | $55,465 |
| 2020 | $1,957 | $56,752 | $14,000 | $42,752 |
| 2019 | $1,863 | $53,214 | $14,000 | $39,214 |
| 2018 | $1,844 | $52,004 | $14,000 | $38,004 |
| 2017 | $1,807 | $50,377 | $14,000 | $36,377 |
| 2016 | $1,822 | $53,482 | $16,800 | $36,682 |
| 2015 | -- | $48,682 | $12,000 | $36,682 |
| 2014 | -- | $39,686 | $8,800 | $30,886 |
| 2013 | -- | $35,725 | $4,840 | $30,885 |
Source: Public Records
Map
Nearby Homes
- 165 Jennifer Cir
- 0 Huger St Unit SA338762
- 127 Crystal Dr
- 131 Crystal Dr
- 98 Magnolia Dr
- 107 Charlton Rd
- 5475 Mccall Rd
- 100 Usher Place
- 127 John Glenn Dr
- 214 Hasty Point Rd
- 44 Marsh Salt Ln
- 22 Marsh Salt Ln
- 104 Hasty Point Rd
- 101 Greene Dr
- 108 Hasty Point Rd
- 110 Hasty Point Rd
- 112 Hasty Point Rd
- 93 Marsh Salt Ln
- 106 Marsh Salt Ln
- 84 Marsh Salt Ln
- 176 Jennifer Cir
- 174 Jennifer Cir
- 178 Jennifer Cir
- 172 Jennifer Cir
- 180 Jennifer Cir
- 147 Jennifer Cir
- 182 Jennifer Cir
- 145 Jennifer Cir
- 170 Jennifer Cir
- 106 Dogwood Cir
- 143 Jennifer Cir
- 184 Jennifer Cir
- 184 Jennifer Cir Unit 127
- 168 Jennifer Cir
- 149 Jennifer Cir
- 104 Dogwood Cir
- 108 Dogwood Cir
- 121 Lauren Dr
- 126 Highland Dr
- 166 Jennifer Cir