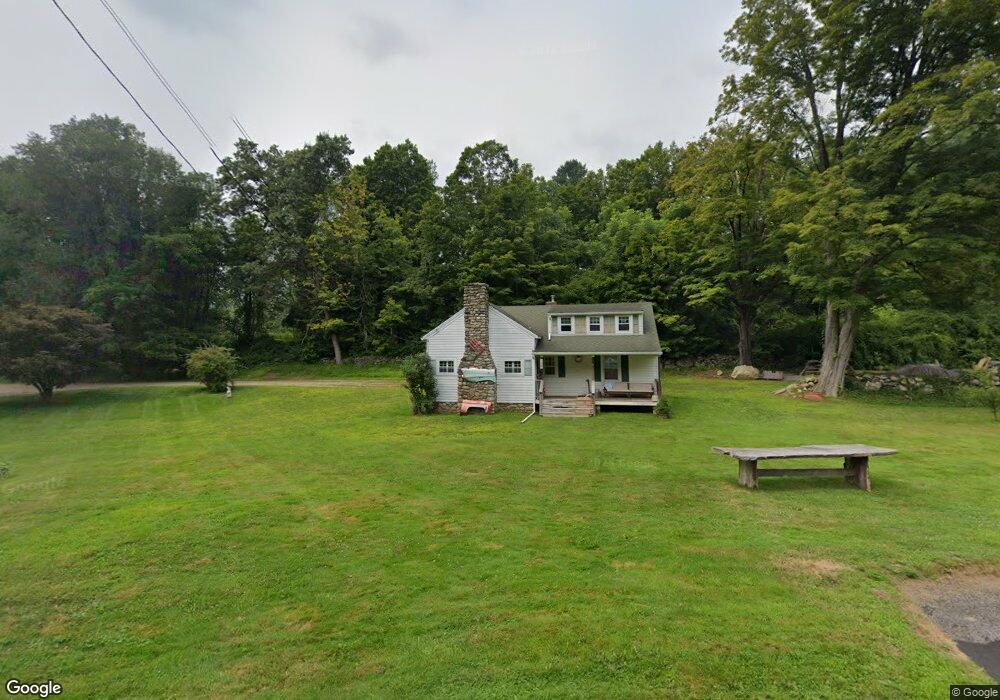
176 Kent Rd S Cornwall Bridge, CT 06754
Estimated Value: $225,820 - $473,000
3
Beds
1
Bath
1,362
Sq Ft
$260/Sq Ft
Est. Value
About This Home
This home is located at 176 Kent Rd S, Cornwall Bridge, CT 06754 and is currently estimated at $353,705, approximately $259 per square foot. 176 Kent Rd S is a home located in Litchfield County with nearby schools including Cornwall Consolidated School and Housatonic Valley Regional High School.
Ownership History
Date
Name
Owned For
Owner Type
Purchase Details
Closed on
Dec 29, 2021
Sold by
Marchetti Joseph
Bought by
Pequignot Aaron S and Nordskog Ingrid K
Current Estimated Value
Home Financials for this Owner
Home Financials are based on the most recent Mortgage that was taken out on this home.
Original Mortgage
$112,500
Outstanding Balance
$102,616
Interest Rate
3.11%
Mortgage Type
Purchase Money Mortgage
Estimated Equity
$251,089
Purchase Details
Closed on
Sep 5, 2006
Sold by
Murphy Paul G and Powers Thomas
Bought by
Marchetti Joseph and Marchetti Cheryl M
Purchase Details
Closed on
Jul 20, 1999
Sold by
Cavanaugh Nellie Est and Mackinnon
Bought by
Murphy Paul G and Powers Thomas
Home Financials for this Owner
Home Financials are based on the most recent Mortgage that was taken out on this home.
Original Mortgage
$104,000
Interest Rate
7.39%
Mortgage Type
Purchase Money Mortgage
Purchase Details
Closed on
Oct 9, 1998
Sold by
Dowlin Harold H
Bought by
Hart James H and Hart Katharine E
Create a Home Valuation Report for This Property
The Home Valuation Report is an in-depth analysis detailing your home's value as well as a comparison with similar homes in the area
Home Values in the Area
Average Home Value in this Area
Purchase History
| Date | Buyer | Sale Price | Title Company |
|---|---|---|---|
| Pequignot Aaron S | $150,000 | None Available | |
| Marchetti Joseph | $270,000 | -- | |
| Murphy Paul G | $130,000 | -- | |
| Hart James H | $50,000 | -- |
Source: Public Records
Mortgage History
| Date | Status | Borrower | Loan Amount |
|---|---|---|---|
| Open | Pequignot Aaron S | $112,500 | |
| Previous Owner | Hart James H | $104,000 |
Source: Public Records
Tax History
| Year | Tax Paid | Tax Assessment Tax Assessment Total Assessment is a certain percentage of the fair market value that is determined by local assessors to be the total taxable value of land and additions on the property. | Land | Improvement |
|---|---|---|---|---|
| 2025 | $2,290 | $143,500 | $32,500 | $111,000 |
| 2024 | $2,196 | $143,500 | $32,500 | $111,000 |
| 2023 | $2,109 | $143,500 | $32,500 | $111,000 |
| 2022 | $2,079 | $143,500 | $32,500 | $111,000 |
| 2021 | $1,946 | $116,500 | $24,400 | $92,100 |
| 2020 | $1,947 | $116,600 | $24,400 | $92,200 |
| 2019 | $1,947 | $116,600 | $24,400 | $92,200 |
| 2018 | $1,938 | $116,600 | $24,400 | $92,200 |
| 2017 | $1,880 | $116,600 | $24,400 | $92,200 |
| 2016 | $2,122 | $138,600 | $28,400 | $110,200 |
| 2015 | $2,097 | $138,600 | $28,400 | $110,200 |
| 2014 | $2,065 | $138,600 | $28,400 | $110,200 |
Source: Public Records
Map
Nearby Homes
- 70 Kent Rd S
- 143 Whitcomb Hill Rd
- 11 Day Rd
- 11 Old Paddock Ln
- 0 Stonewall Unit 39
- 9 Jewell St
- 0 W Woods Rd Unit 2
- 1 W Woods Rd
- 0 Mount Mauwee Rd
- 102 Melius Rd
- 23 Mauwee Brook Rd
- 0 Gorham Rd Unit 24138133
- 34 Kent Rd
- 0 Lake Rd
- 3 W Mountain Rd
- 221 Fuller Mountain Rd
- 308 Skiff Mountain Rd
- 200 Sharon Mountain Rd
- 25 Bowne Rd
- 0 Railroad St
- 170 Kent Rd
- 170 Kent Rd
- 170 Kent Rd
- 170&182 S Kent Rd S
- 159 Kent Rd S
- 159 Kent Rd S
- 2 Swifts Bridge Rd
- 0 Kent Rd S Unit 170446052
- A02 Kent Rd S
- 0 Kent Rd S
- 250 Kent Rd S
- 270 Kent Rd S
- 8 Swifts Bridge Rd
- 10 Swifts Bridge Rd
- 156 Kent Rd S
- 183 Kent Rd S
- 1 Warren Hill Rd
- 150 Kent Rd S
- 22 Soltis Ln
- 15 Swifts Bridge Rd
Your Personal Tour Guide
Ask me questions while you tour the home.