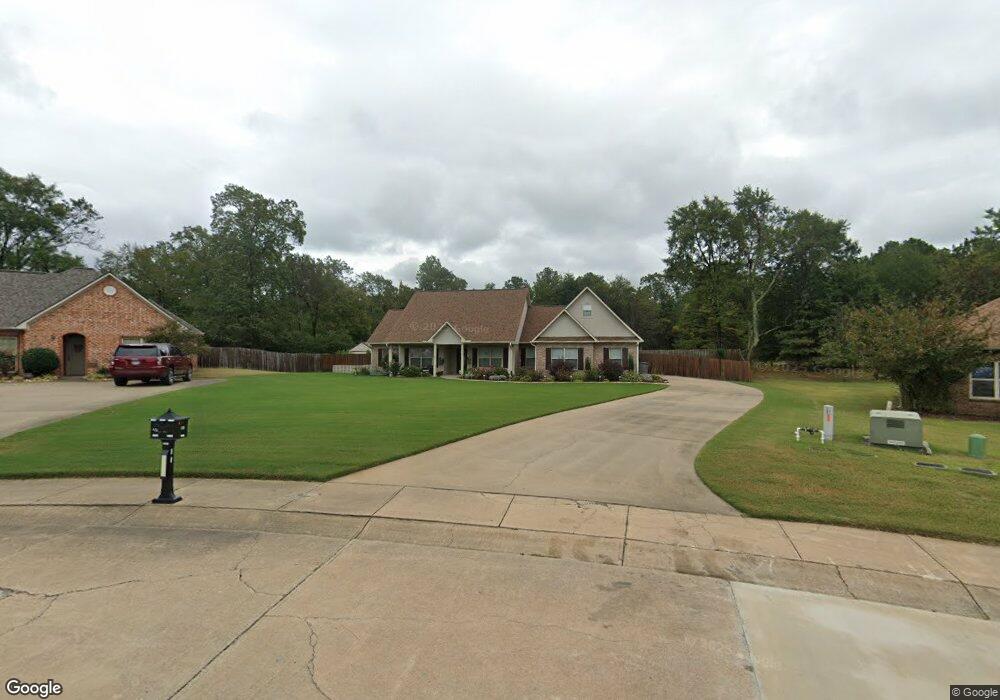
176 Mapleleaf Cir Hot Springs National Park, AR 71901
Estimated Value: $361,910 - $519,000
--
Bed
2
Baths
2,223
Sq Ft
$184/Sq Ft
Est. Value
About This Home
This home is located at 176 Mapleleaf Cir, Hot Springs National Park, AR 71901 and is currently estimated at $408,478, approximately $183 per square foot. 176 Mapleleaf Cir is a home located in Garland County with nearby schools including Lakeside Primary School, Lakeside Intermediate School, and Lakeside Junior High School.
Ownership History
Date
Name
Owned For
Owner Type
Purchase Details
Closed on
Sep 28, 2012
Sold by
Tkach Robert D and Tkach Cynthia A
Bought by
Trickey Beverly Jane
Current Estimated Value
Home Financials for this Owner
Home Financials are based on the most recent Mortgage that was taken out on this home.
Original Mortgage
$190,000
Outstanding Balance
$132,029
Interest Rate
3.66%
Mortgage Type
New Conventional
Estimated Equity
$276,449
Purchase Details
Closed on
Jul 23, 2009
Sold by
Evans Brian and Evans Shannon
Bought by
Tkach Robert D and Tkach Cynthia A
Home Financials for this Owner
Home Financials are based on the most recent Mortgage that was taken out on this home.
Original Mortgage
$244,489
Interest Rate
5.71%
Mortgage Type
FHA
Purchase Details
Closed on
Apr 11, 2006
Sold by
Not Provided
Bought by
Evans Brian
Purchase Details
Closed on
Nov 22, 2005
Sold by
Lakeside Estates Llc
Bought by
4M Ventures Llc
Purchase Details
Closed on
Nov 15, 2005
Sold by
Not Provided
Bought by
Evans Brian
Create a Home Valuation Report for This Property
The Home Valuation Report is an in-depth analysis detailing your home's value as well as a comparison with similar homes in the area
Home Values in the Area
Average Home Value in this Area
Purchase History
| Date | Buyer | Sale Price | Title Company |
|---|---|---|---|
| Trickey Beverly Jane | $250,000 | Garland County Title Co | |
| Tkach Robert D | $249,000 | Garland County Title Co | |
| Evans Brian | $35,000 | -- | |
| 4M Ventures Llc | $25,000 | Garland County Title Company | |
| Evans Brian | $35,000 | -- |
Source: Public Records
Mortgage History
| Date | Status | Borrower | Loan Amount |
|---|---|---|---|
| Open | Trickey Beverly Jane | $190,000 | |
| Previous Owner | Tkach Robert D | $244,489 |
Source: Public Records
Tax History Compared to Growth
Tax History
| Year | Tax Paid | Tax Assessment Tax Assessment Total Assessment is a certain percentage of the fair market value that is determined by local assessors to be the total taxable value of land and additions on the property. | Land | Improvement |
|---|---|---|---|---|
| 2025 | $1,488 | $65,950 | $5,700 | $60,250 |
| 2024 | $1,560 | $65,950 | $5,700 | $60,250 |
| 2023 | $1,635 | $65,950 | $5,700 | $60,250 |
| 2022 | $2,060 | $65,950 | $5,700 | $60,250 |
| 2021 | $2,079 | $45,890 | $3,750 | $42,140 |
| 2020 | $1,704 | $45,890 | $3,750 | $42,140 |
| 2019 | $1,704 | $45,890 | $3,750 | $42,140 |
| 2018 | $1,704 | $45,890 | $3,750 | $42,140 |
| 2017 | $1,662 | $45,890 | $3,750 | $42,140 |
| 2016 | $1,560 | $43,510 | $4,500 | $39,010 |
| 2015 | $1,447 | $43,510 | $4,500 | $39,010 |
| 2014 | $1,446 | $43,510 | $4,500 | $39,010 |
Source: Public Records
Map
Nearby Homes
- 172 Mapleleaf Cir
- 166 Mapleleaf Cir
- 114 Silverleaf St
- 256 Mapleleaf Cir
- 000 Shady Grove Rd
- 604 Shady Heights Rd
- 117 Skyline Dr
- 418 Pine Meadows Loop
- 136 Green Mountain Ct
- 105 Tamarack Ct
- 285 Wilson Lake Ln
- 2748 Malvern Ave
- 0 Malvern Ave Unit 147548
- Lot 8 Damien Ct
- 103 Longleaf Ct
- 122 Lance Cir
- 523 Skyline Dr
- 126 Lance Cir
- 225 Bluebell Ct
- 812 Shady Heights Rd
- 200 Mapleleaf Cir
- 206 Mapleleaf Cir
- 169 Mapleleaf Cir
- 158 Mapleleaf Cir
- 211 Mapleleaf Cir
- 155 Mapleleaf Cir
- 222 Mapleleaf Cir
- 219 Mapleleaf Cir
- 148 Mapleleaf Cir
- 230 Mapleleaf Cir
- 227 Mapleleaf Cir
- 124 Silverleaf St
- 140 Mapleleaf Cir
- 200 Carpenter Ct
- 238 Mapleleaf Cir
- 132 Silverleaf St
- 137 Mapleleaf Cir
- 237 Mapleleaf Cir
- 132 Mapleleaf Cir
- 113 Silverleaf St