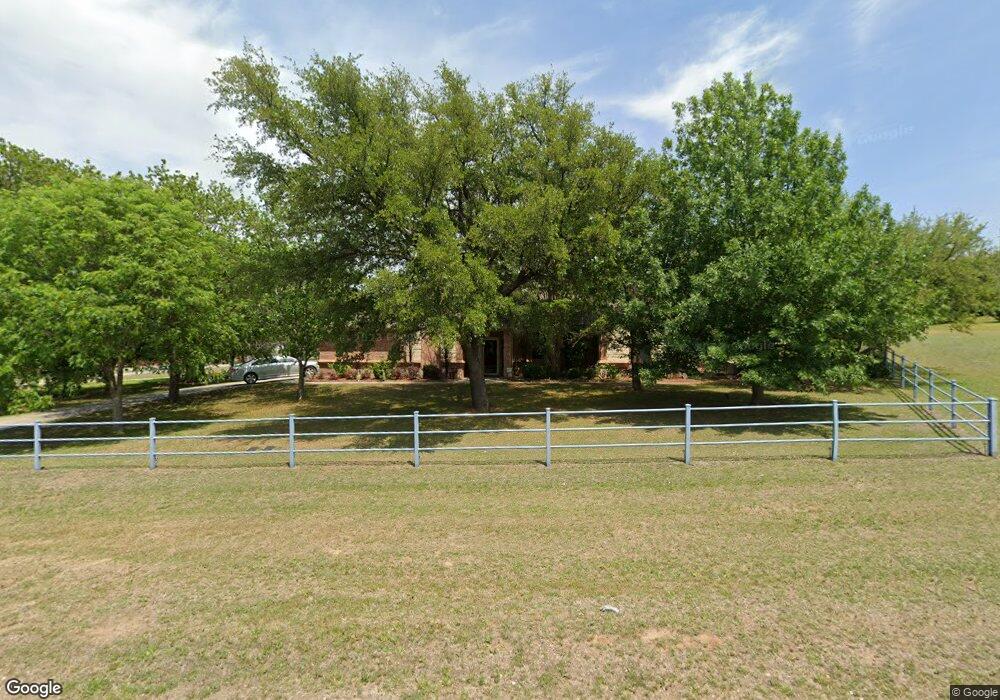
176 Miramar Cir Weatherford, TX 76085
Estimated Value: $429,000 - $475,000
3
Beds
2
Baths
2,140
Sq Ft
$212/Sq Ft
Est. Value
About This Home
This home is located at 176 Miramar Cir, Weatherford, TX 76085 and is currently estimated at $453,265, approximately $211 per square foot. 176 Miramar Cir is a home located in Parker County with nearby schools including Silver Creek Elementary School, Azle Elementary School, and Azle Junior High School.
Ownership History
Date
Name
Owned For
Owner Type
Purchase Details
Closed on
Sep 15, 2011
Sold by
Mathes George W and Mathes Bettie J
Bought by
King Ii Joseph Leon and King Michelle A
Current Estimated Value
Home Financials for this Owner
Home Financials are based on the most recent Mortgage that was taken out on this home.
Original Mortgage
$199,192
Outstanding Balance
$137,508
Interest Rate
4.43%
Mortgage Type
VA
Estimated Equity
$315,757
Purchase Details
Closed on
Feb 17, 2006
Sold by
C & A Classic Homes Lp
Bought by
King Joseph Leon and King Michelle A
Purchase Details
Closed on
Oct 28, 2005
Sold by
Partagas Properties Ltd
Bought by
King Joseph Leon and King Michelle A
Home Financials for this Owner
Home Financials are based on the most recent Mortgage that was taken out on this home.
Original Mortgage
$138,533
Interest Rate
5.75%
Mortgage Type
Purchase Money Mortgage
Create a Home Valuation Report for This Property
The Home Valuation Report is an in-depth analysis detailing your home's value as well as a comparison with similar homes in the area
Home Values in the Area
Average Home Value in this Area
Purchase History
| Date | Buyer | Sale Price | Title Company |
|---|---|---|---|
| King Ii Joseph Leon | -- | None Available | |
| King Joseph Leon | -- | -- | |
| Mathes George W | -- | None Available | |
| King Joseph Leon | -- | -- | |
| C & A Classic Homes Lp | -- | None Available |
Source: Public Records
Mortgage History
| Date | Status | Borrower | Loan Amount |
|---|---|---|---|
| Open | King Ii Joseph Leon | $199,192 | |
| Previous Owner | C & A Classic Homes Lp | $138,533 |
Source: Public Records
Tax History Compared to Growth
Tax History
| Year | Tax Paid | Tax Assessment Tax Assessment Total Assessment is a certain percentage of the fair market value that is determined by local assessors to be the total taxable value of land and additions on the property. | Land | Improvement |
|---|---|---|---|---|
| 2025 | -- | $450,106 | -- | -- |
| 2024 | -- | $409,187 | -- | -- |
| 2023 | $5,962 | $370,640 | $0 | $0 |
| 2022 | $4,557 | $246,270 | $43,660 | $202,610 |
| 2021 | $4,775 | $246,270 | $43,660 | $202,610 |
| 2020 | $4,115 | $213,390 | $34,800 | $178,590 |
| 2019 | $4,361 | $213,390 | $34,800 | $178,590 |
| 2018 | $3,681 | $179,550 | $30,000 | $149,550 |
| 2017 | $3,430 | $179,550 | $30,000 | $149,550 |
| 2016 | $3,118 | $159,620 | $30,000 | $129,620 |
| 2015 | $1,149 | $159,620 | $30,000 | $129,620 |
| 2014 | -- | $162,180 | $30,000 | $132,180 |
Source: Public Records
Map
Nearby Homes
- 110 Bolivar Dr
- 133 Miramar Cir
- 209 Churchill Ct
- 181 Churchill Cir
- 4024 Olivia Lucille St
- 7503 Sabathney Rd
- 174 Scott Ln
- 357 Mastadon Way
- 149 Bryon Dr
- 9999 S Fm 730
- 5017 Freestone Dr
- 1904 Glendale Dr
- 1089 Flagstone Dr
- 1020 Boulder Rd
- 6021 Piper Anne St
- 120 Live Oak St
- 8009 Encanto Way
- 8001 Encanto Way
- 8000 Encanto Way
- 8017 Alegre Ct
- 170 Miramar Cir
- 173 Miramar Cir
- 177 Miramar Cir
- 105 Bolivar Dr
- 101 Bolivar Dr
- 183 Miramar Cir
- 215 Royal Ct
- 109 Bolivar Dr
- 164 Miramar Cir
- 165 Miramar Cir
- 211 Royal Ct
- 113 Bolivar Dr
- 161 Miramar Cir
- 114 Bolivar Dr
- 104 Santa Clara Dr
- 207 Royal Ct
- 117 Bolivar Dr
- 157 Miramar Cir
- 100 Santa Clara Dr
- 120 Bolivar Dr