176 Moreland St Worcester, MA 01609
Salisbury Street NeighborhoodEstimated Value: $417,000 - $480,000
3
Beds
1
Bath
1,296
Sq Ft
$340/Sq Ft
Est. Value
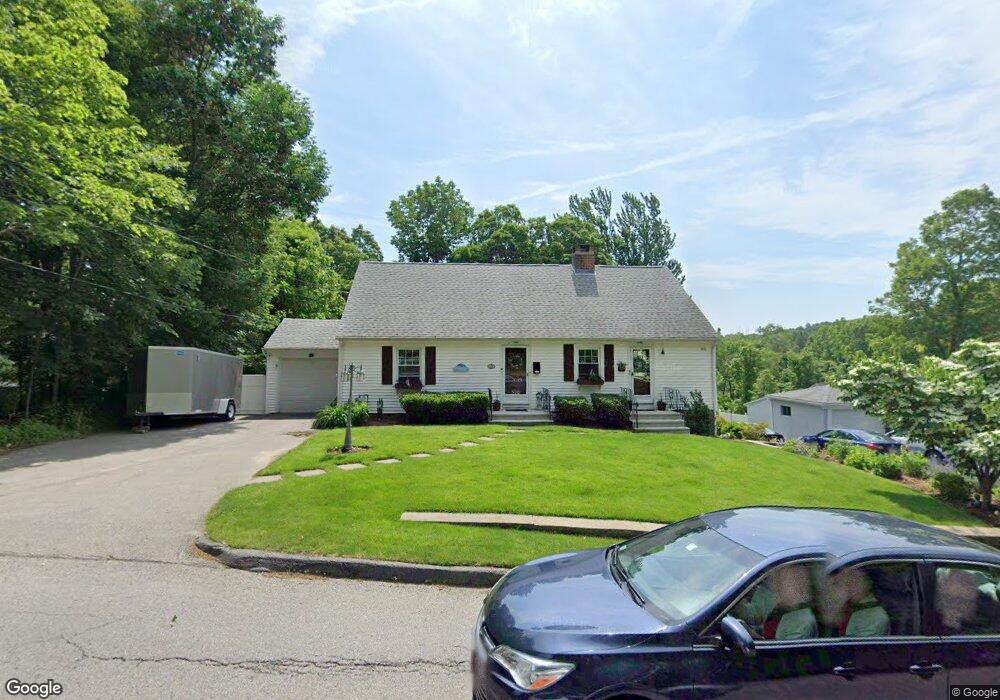
About This Home
This home is located at 176 Moreland St, Worcester, MA 01609 and is currently estimated at $440,944, approximately $340 per square foot. 176 Moreland St is a home located in Worcester County with nearby schools including Chandler Magnet, Jacob Hiatt Magnet School, and Flagg Street School.
Ownership History
Date
Name
Owned For
Owner Type
Purchase Details
Closed on
Jun 19, 1992
Sold by
Peterson Eleanor A
Bought by
Pappas Thomas F and Pappas Christine
Current Estimated Value
Home Financials for this Owner
Home Financials are based on the most recent Mortgage that was taken out on this home.
Original Mortgage
$89,600
Interest Rate
8.67%
Mortgage Type
Purchase Money Mortgage
Create a Home Valuation Report for This Property
The Home Valuation Report is an in-depth analysis detailing your home's value as well as a comparison with similar homes in the area
Home Values in the Area
Average Home Value in this Area
Purchase History
| Date | Buyer | Sale Price | Title Company |
|---|---|---|---|
| Pappas Thomas F | $112,000 | -- |
Source: Public Records
Mortgage History
| Date | Status | Borrower | Loan Amount |
|---|---|---|---|
| Open | Pappas Thomas F | $115,000 | |
| Closed | Pappas Thomas F | $89,000 | |
| Closed | Pappas Thomas F | $89,600 |
Source: Public Records
Tax History
| Year | Tax Paid | Tax Assessment Tax Assessment Total Assessment is a certain percentage of the fair market value that is determined by local assessors to be the total taxable value of land and additions on the property. | Land | Improvement |
|---|---|---|---|---|
| 2025 | $4,929 | $373,700 | $124,600 | $249,100 |
| 2024 | $4,843 | $352,200 | $124,600 | $227,600 |
| 2023 | $4,622 | $322,300 | $107,300 | $215,000 |
| 2022 | $4,230 | $278,100 | $85,900 | $192,200 |
| 2021 | $4,090 | $251,200 | $68,800 | $182,400 |
| 2020 | $4,158 | $244,600 | $68,600 | $176,000 |
| 2019 | $4,043 | $224,600 | $66,400 | $158,200 |
| 2018 | $4,060 | $214,700 | $66,400 | $148,300 |
| 2017 | $3,896 | $202,700 | $66,400 | $136,300 |
| 2016 | $3,965 | $192,400 | $56,100 | $136,300 |
| 2015 | $3,861 | $192,400 | $56,100 | $136,300 |
| 2014 | $3,759 | $192,400 | $56,100 | $136,300 |
Source: Public Records
Map
Nearby Homes
- 163 Moreland St
- 23 Orrison St
- 85 Camelot Dr Unit 118
- 32 Aylesbury Rd
- 18 Merlin Ct Unit 18
- 118 Beaconsfield Rd
- 3 Old English Rd
- 122 Copperfield Rd
- 148A Tory Fort Ln
- 22 Audubon Rd
- 28 Lynnwood Ln
- 9 Dennison Rd
- 10 Salisbury Hill Blvd Unit 75
- 493 Salisbury St
- 10 Baiting Brook Ln Unit 67
- 14 Baiting Brook Ln Unit 65
- 16 Baiting Brook Ln Unit 64
- 1 Baiting Brook Ln Unit 50
- 23 Tiverton Pkwy
- 12 Cardinal Rd
Your Personal Tour Guide
Ask me questions while you tour the home.