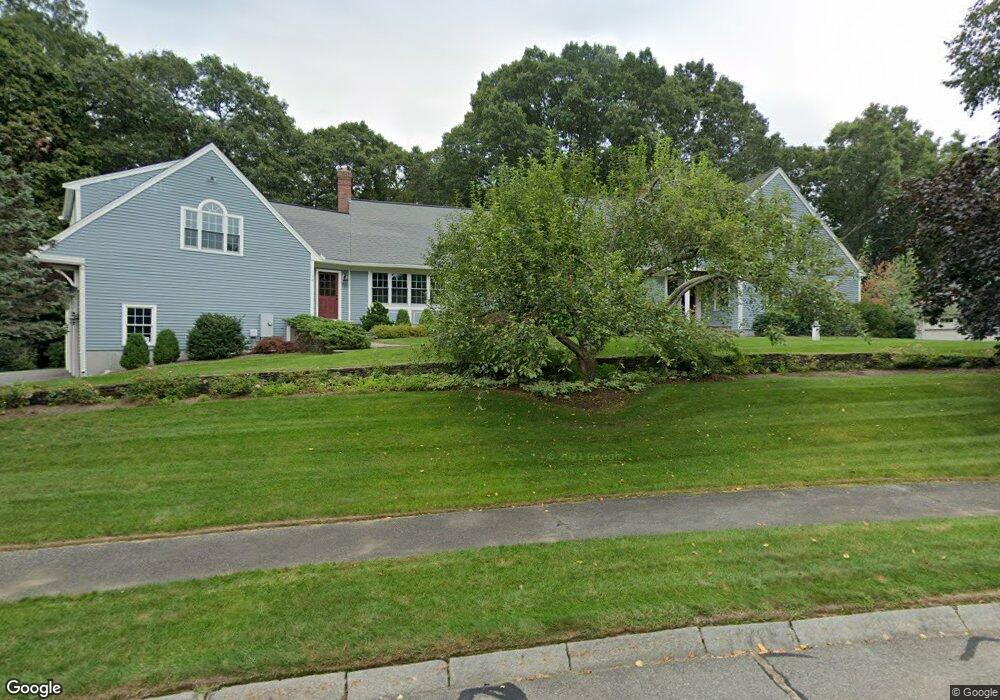
176 Partridge Ln Concord, MA 01742
Estimated Value: $2,439,844 - $2,833,000
4
Beds
4
Baths
4,309
Sq Ft
$633/Sq Ft
Est. Value
About This Home
This home is located at 176 Partridge Ln, Concord, MA 01742 and is currently estimated at $2,726,461, approximately $632 per square foot. 176 Partridge Ln is a home located in Middlesex County with nearby schools including Alcott Elementary School, Concord Middle School, and The Fenn School.
Ownership History
Date
Name
Owned For
Owner Type
Purchase Details
Closed on
Feb 10, 2011
Sold by
Phillips Michael R and Phillips Emily B
Bought by
Phillips Emily B
Current Estimated Value
Home Financials for this Owner
Home Financials are based on the most recent Mortgage that was taken out on this home.
Original Mortgage
$523,700
Outstanding Balance
$349,969
Interest Rate
4.37%
Estimated Equity
$2,376,492
Purchase Details
Closed on
Jun 30, 2008
Sold by
Nanent Jose
Bought by
Phillips Emily Brown and Phillips Michael Reese
Home Financials for this Owner
Home Financials are based on the most recent Mortgage that was taken out on this home.
Original Mortgage
$857,500
Interest Rate
6.07%
Mortgage Type
Purchase Money Mortgage
Purchase Details
Closed on
Jun 18, 1999
Sold by
Murray Daniel M and Murray Wilhelmina
Bought by
Manent Jose
Home Financials for this Owner
Home Financials are based on the most recent Mortgage that was taken out on this home.
Original Mortgage
$700,000
Interest Rate
6.99%
Mortgage Type
Purchase Money Mortgage
Create a Home Valuation Report for This Property
The Home Valuation Report is an in-depth analysis detailing your home's value as well as a comparison with similar homes in the area
Home Values in the Area
Average Home Value in this Area
Purchase History
| Date | Buyer | Sale Price | Title Company |
|---|---|---|---|
| Phillips Emily B | -- | -- | |
| Phillips Emily Brown | $1,225,000 | -- | |
| Manent Jose | $875,000 | -- |
Source: Public Records
Mortgage History
| Date | Status | Borrower | Loan Amount |
|---|---|---|---|
| Open | Manent Jose | $523,700 | |
| Previous Owner | Manent Jose | $740,000 | |
| Previous Owner | Phillips Emily Brown | $857,500 | |
| Previous Owner | Manent Jose | $700,000 |
Source: Public Records
Tax History Compared to Growth
Tax History
| Year | Tax Paid | Tax Assessment Tax Assessment Total Assessment is a certain percentage of the fair market value that is determined by local assessors to be the total taxable value of land and additions on the property. | Land | Improvement |
|---|---|---|---|---|
| 2025 | $310 | $2,334,800 | $633,200 | $1,701,600 |
| 2024 | $30,656 | $2,334,800 | $633,200 | $1,701,600 |
| 2023 | $25,400 | $1,959,900 | $575,700 | $1,384,200 |
| 2022 | $24,246 | $1,642,700 | $460,500 | $1,182,200 |
| 2021 | $24,369 | $1,655,500 | $460,500 | $1,195,000 |
| 2020 | $23,578 | $1,656,900 | $460,500 | $1,196,400 |
| 2019 | $25,156 | $1,772,800 | $447,000 | $1,325,800 |
| 2018 | $23,326 | $1,632,300 | $425,700 | $1,206,600 |
| 2017 | $22,681 | $1,612,000 | $405,400 | $1,206,600 |
| 2016 | $22,065 | $1,585,100 | $405,400 | $1,179,700 |
| 2015 | $20,891 | $1,461,900 | $375,500 | $1,086,400 |
Source: Public Records
Map
Nearby Homes
- 35 Chestnut St
- 140 Revolutionary Rd
- 38-40 Court Ln
- 96 Independence Rd
- 143 Everett St
- 46 Sudbury Rd
- 61B Walden St
- 14 Thoreau St
- 232 Sudbury Rd
- 84 Bruce Rd
- 22 Belknap Ct
- 58 Peter Spring Rd
- 49 Willard Common
- 29 Willard Common
- 182 Southfield Rd
- 106 Elm St
- 236 Fairhaven Rd
- 646 Cambridge Turnpike
- 16 Hatch Farm Ln
- 10 Hatch Farm Ln
- 95 Walnut St
- 170 Partridge Ln
- 192 Partridge Ln
- 169 Partridge Ln
- 99 Walnut St
- 193 Partridge Ln
- 135 Partridge Ln
- 91 Walnut St
- 210 Partridge Ln
- 111 Partridge Ln
- 142 Chestnut St
- 152 Partridge Ln
- 181 Lexington Rd
- 205 Partridge Ln
- 205 Partridge Ln Unit 1
- 83 Walnut St
- 145 Lexington Rd
- 2 Off Cambridge Turnpike
- 70 Walnut St
- 132 Chestnut St