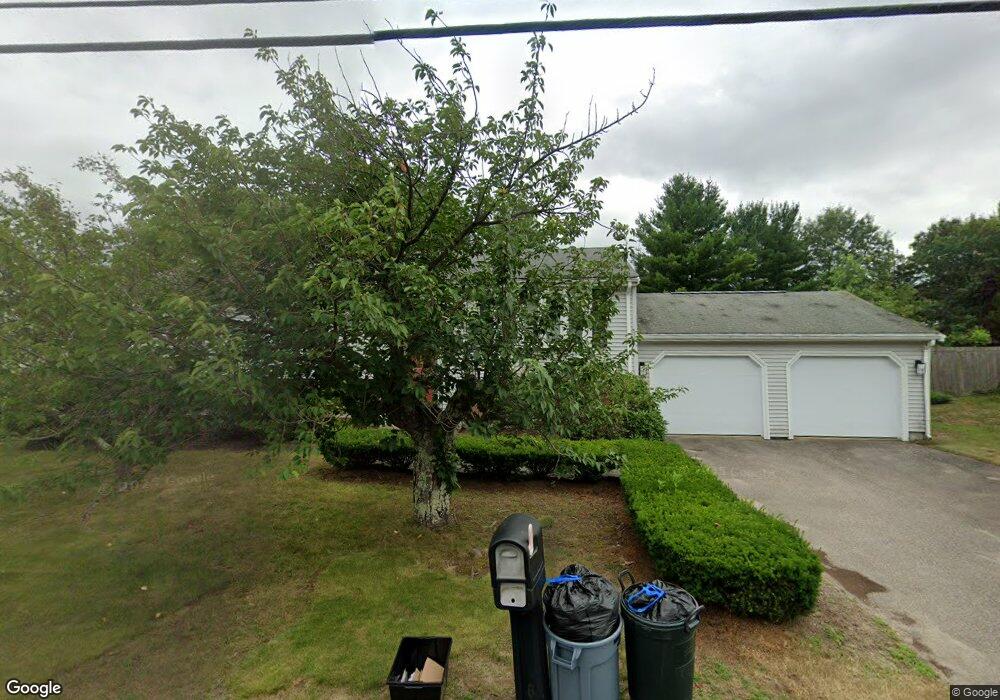
176 Powell St Stoughton, MA 02072
Estimated Value: $666,478 - $718,000
4
Beds
2
Baths
2,138
Sq Ft
$326/Sq Ft
Est. Value
About This Home
This home is located at 176 Powell St, Stoughton, MA 02072 and is currently estimated at $697,370, approximately $326 per square foot. 176 Powell St is a home located in Norfolk County with nearby schools including Helen Hansen Elementary School, O'Donnell Middle School, and Stoughton High School.
Ownership History
Date
Name
Owned For
Owner Type
Purchase Details
Closed on
Aug 30, 2002
Sold by
Marshall William and Marshall Lynne
Bought by
Marshall William H and Marshall Pattie
Current Estimated Value
Create a Home Valuation Report for This Property
The Home Valuation Report is an in-depth analysis detailing your home's value as well as a comparison with similar homes in the area
Home Values in the Area
Average Home Value in this Area
Purchase History
| Date | Buyer | Sale Price | Title Company |
|---|---|---|---|
| Marshall William H | $127,762 | -- | |
| Marshall William H | $127,762 | -- |
Source: Public Records
Mortgage History
| Date | Status | Borrower | Loan Amount |
|---|---|---|---|
| Previous Owner | Marshall William H | $80,000 | |
| Previous Owner | Marshall William H | $80,000 | |
| Previous Owner | Marshall William H | $60,000 |
Source: Public Records
Tax History
| Year | Tax Paid | Tax Assessment Tax Assessment Total Assessment is a certain percentage of the fair market value that is determined by local assessors to be the total taxable value of land and additions on the property. | Land | Improvement |
|---|---|---|---|---|
| 2025 | $7,161 | $578,400 | $224,000 | $354,400 |
| 2024 | $6,965 | $547,100 | $204,600 | $342,500 |
| 2023 | $6,687 | $493,500 | $186,900 | $306,600 |
| 2022 | $6,545 | $454,200 | $179,900 | $274,300 |
| 2021 | $6,156 | $407,700 | $158,700 | $249,000 |
| 2020 | $5,923 | $397,800 | $158,700 | $239,100 |
| 2019 | $5,967 | $389,000 | $158,700 | $230,300 |
| 2018 | $5,277 | $356,300 | $151,700 | $204,600 |
| 2017 | $5,050 | $348,500 | $149,900 | $198,600 |
| 2016 | $4,871 | $325,400 | $135,800 | $189,600 |
| 2015 | $4,816 | $318,300 | $128,700 | $189,600 |
| 2014 | $4,730 | $300,500 | $118,200 | $182,300 |
Source: Public Records
Map
Nearby Homes
- 4 Robinette Rd
- 18 Mallard Dr
- 102 Chisholm Rd
- 12 Eastwood Rd
- 61 Lincoln Rd
- 84 Kim Terrace
- 90 Charles Cir
- 72 Kim Terrace Unit C
- 70 Deerfield Rd
- 34 Copperwood Dr Unit 34
- 438 School St
- 2196 Central St
- 11 Wilshire Dr
- 72 Copperwood Dr Unit 19
- 62 Bishop Rd
- 52 Edward Dr Unit 52
- 6 Jessica Dr Unit E
- 55 Brian Dr Unit G
- 12 Greenbrook Dr
- 109 Greenbrook Dr Unit 109
Your Personal Tour Guide
Ask me questions while you tour the home.