Estimated Value: $113,000 - $163,000
Studio
--
Bath
1,326
Sq Ft
$98/Sq Ft
Est. Value
About This Home
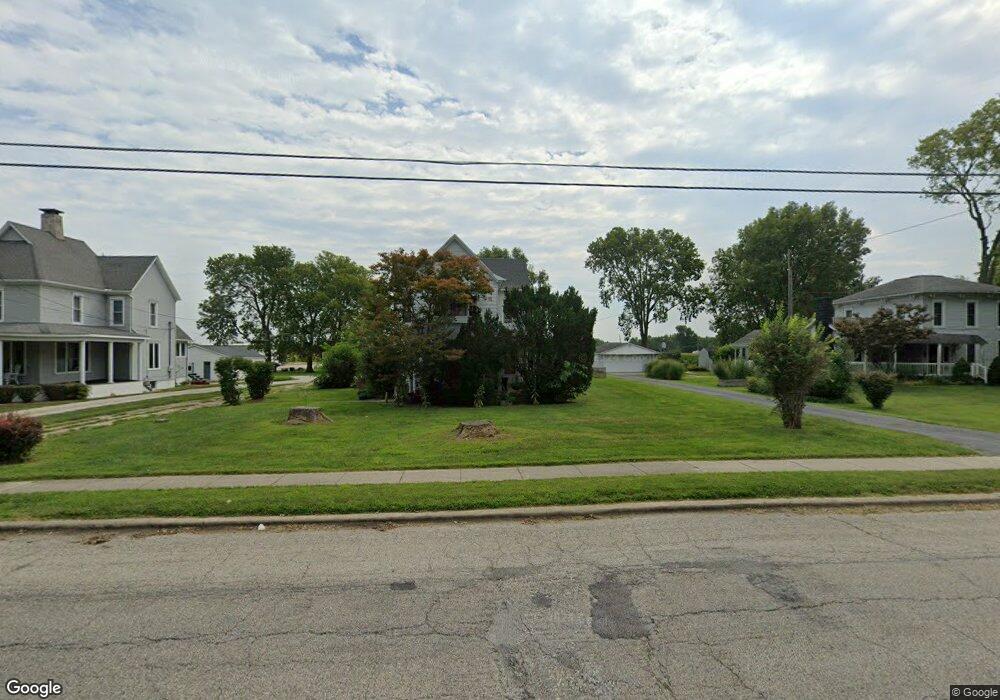
This home is located at 176 S Wall St, Macon, IL 62544 and is currently estimated at $129,728, approximately $97 per square foot. 176 S Wall St is a home located in Macon County with nearby schools including Meridian Middle School and Meridian High School.
Ownership History
Date
Name
Owned For
Owner Type
Purchase Details
Closed on
Jun 1, 1993
Current Estimated Value
Create a Home Valuation Report for This Property
The Home Valuation Report is an in-depth analysis detailing your home's value as well as a comparison with similar homes in the area
Purchase History
| Date | Buyer | Sale Price | Title Company |
|---|---|---|---|
| -- | $57,000 | -- |
Source: Public Records
Tax History
| Year | Tax Paid | Tax Assessment Tax Assessment Total Assessment is a certain percentage of the fair market value that is determined by local assessors to be the total taxable value of land and additions on the property. | Land | Improvement |
|---|---|---|---|---|
| 2024 | $1,340 | $35,323 | $5,089 | $30,234 |
| 2023 | $1,395 | $32,001 | $4,610 | $27,391 |
| 2022 | $1,439 | $30,567 | $4,403 | $26,164 |
| 2021 | $2,408 | $29,035 | $4,183 | $24,852 |
| 2020 | $2,388 | $27,361 | $3,942 | $23,419 |
| 2019 | $2,388 | $27,361 | $3,942 | $23,419 |
| 2018 | $2,339 | $26,711 | $3,848 | $22,863 |
| 2017 | $2,341 | $26,823 | $3,864 | $22,959 |
| 2016 | $1,870 | $26,790 | $3,859 | $22,931 |
| 2015 | $1,783 | $26,010 | $3,747 | $22,263 |
| 2014 | $1,687 | $25,753 | $3,710 | $22,043 |
| 2013 | $1,719 | $25,753 | $3,710 | $22,043 |
Source: Public Records
Map
Nearby Homes
- 280 W Dunn St
- Lot 13 Galeana Dr
- Lot 52 Galeana Dr
- 4982 N Woodcock St
- Lot 12 Galeana Dr
- Lot 51 Galeana Dr
- Lot 50 Galeana Dr
- Lot 8 Galena Dr
- Lot 5 Galena Dr
- Lot 7 Galena Dr
- Lot 6 Galena Dr
- Lot 10 Galena Dr
- Lot 11 Galeana Dr
- Lot 49 Galeana Dr
- Lot 9 Galeana Dr
- Lot 54 Lakelaine Dr
- Lot 56 Lakelaine Dr
- Lot 20 Lakelaine Dr
- Lot 17 Lakelaine Dr
- Lot 15 Lakelaine Dr
Your Personal Tour Guide
Ask me questions while you tour the home.