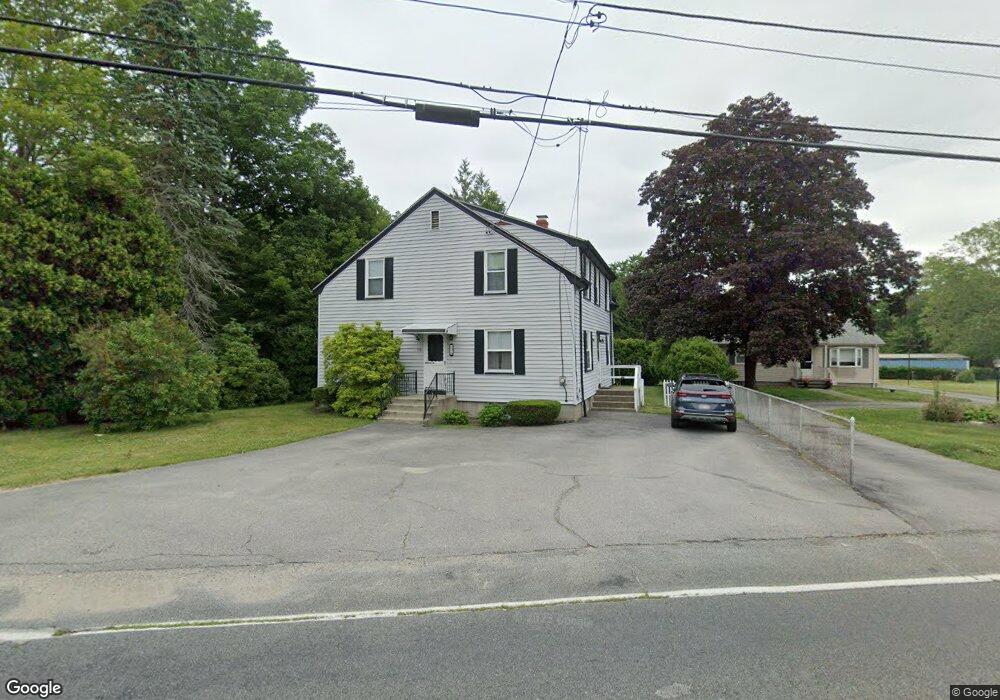
176 Sanford Rd Westport, MA 02790
North Westport NeighborhoodEstimated Value: $458,017 - $561,000
4
Beds
--
Bath
1,904
Sq Ft
$270/Sq Ft
Est. Value
About This Home
This home is located at 176 Sanford Rd, Westport, MA 02790 and is currently estimated at $514,006, approximately $269 per square foot. 176 Sanford Rd is a home located in Bristol County with nearby schools including Alice A. Macomber Primary School, Westport Elementary School, and Westport Middle-High School.
Ownership History
Date
Name
Owned For
Owner Type
Purchase Details
Closed on
May 23, 2019
Sold by
Panaggio Phyllis R
Bought by
Phyllis R Panaggio Irt
Current Estimated Value
Purchase Details
Closed on
Jul 24, 1998
Sold by
Mcgrath Peter P and Mcgrath Jeannette
Bought by
Panaggio Phyllis R
Home Financials for this Owner
Home Financials are based on the most recent Mortgage that was taken out on this home.
Original Mortgage
$90,000
Interest Rate
6.99%
Mortgage Type
Purchase Money Mortgage
Create a Home Valuation Report for This Property
The Home Valuation Report is an in-depth analysis detailing your home's value as well as a comparison with similar homes in the area
Home Values in the Area
Average Home Value in this Area
Purchase History
| Date | Buyer | Sale Price | Title Company |
|---|---|---|---|
| Phyllis R Panaggio Irt | -- | -- | |
| Panaggio Phyllis R | $140,000 | -- |
Source: Public Records
Mortgage History
| Date | Status | Borrower | Loan Amount |
|---|---|---|---|
| Previous Owner | Panaggio Phyllis R | $90,000 | |
| Previous Owner | Panaggio Phyllis R | $7,500 | |
| Closed | Panaggio Phyllis R | $50,000 |
Source: Public Records
Tax History Compared to Growth
Tax History
| Year | Tax Paid | Tax Assessment Tax Assessment Total Assessment is a certain percentage of the fair market value that is determined by local assessors to be the total taxable value of land and additions on the property. | Land | Improvement |
|---|---|---|---|---|
| 2025 | $2,867 | $384,800 | $163,000 | $221,800 |
| 2024 | $2,624 | $339,500 | $144,700 | $194,800 |
| 2023 | $2,548 | $312,300 | $131,800 | $180,500 |
| 2022 | $2,464 | $290,600 | $131,800 | $158,800 |
| 2021 | $2,308 | $267,800 | $109,000 | $158,800 |
| 2020 | $2,220 | $263,400 | $104,600 | $158,800 |
| 2019 | $2,197 | $265,700 | $104,600 | $161,100 |
| 2018 | $2,189 | $267,900 | $104,300 | $163,600 |
| 2017 | $2,038 | $255,700 | $101,000 | $154,700 |
| 2016 | $1,945 | $245,900 | $97,600 | $148,300 |
| 2015 | $1,673 | $211,000 | $99,800 | $111,200 |
Source: Public Records
Map
Nearby Homes
- 33 William St
- 6 Beaulieu St
- 25 Beaulieu St
- 9 Register Ave
- 128 Old Bedford Rd
- 92 Benoit St
- 3 Diane Way
- 100 D Dr
- 34 Alsop St
- 125 Angell St
- 4 Lake Ave
- 951 Dickinson St
- 1130 Hancock St
- 20 Faulkner St
- 961 Wood St
- 37 Eaton St
- 1792 Pleasant St Unit 1808
- 219 Earle St Unit 3
- 217 Earle St Unit 2
- 215 Earle St Unit 1