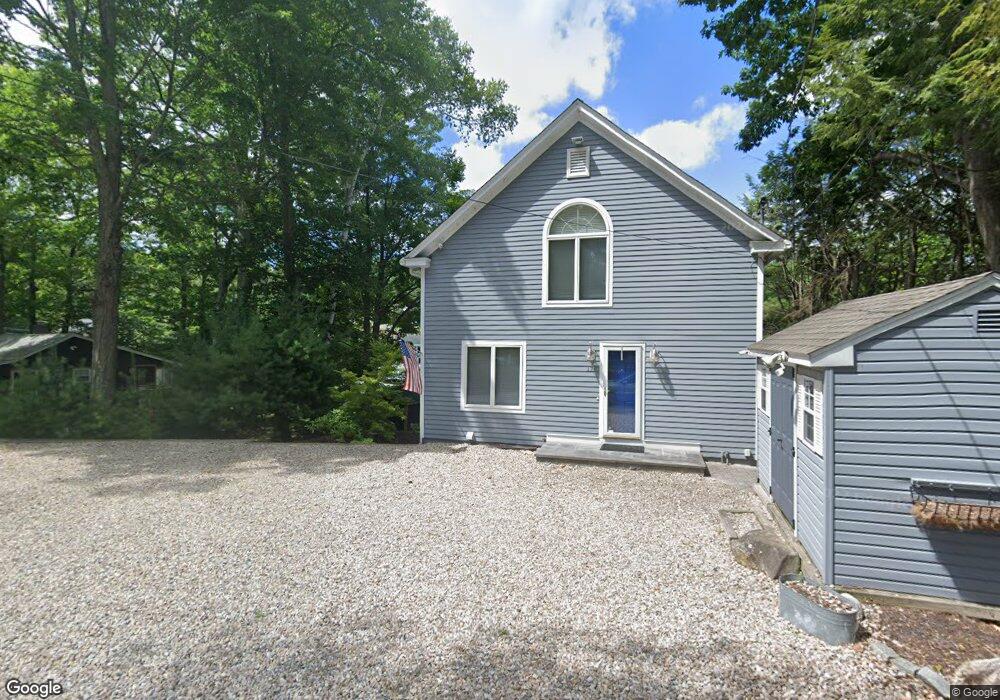
176 Shore Dr Winsted, CT 06098
Estimated Value: $901,000 - $1,273,000
3
Beds
3
Baths
1,598
Sq Ft
$638/Sq Ft
Est. Value
About This Home
This home is located at 176 Shore Dr, Winsted, CT 06098 and is currently estimated at $1,020,147, approximately $638 per square foot. 176 Shore Dr is a home located in Litchfield County with nearby schools including Pearson School, Explorations Charter School, and St Anthony School.
Ownership History
Date
Name
Owned For
Owner Type
Purchase Details
Closed on
Jul 29, 2020
Sold by
Robert S & K F Brackett Ret
Bought by
Perra Timothy R and Watlz-Perra Kristin
Current Estimated Value
Purchase Details
Closed on
Aug 31, 2015
Sold by
Forst-Brackett Kathleen
Bought by
Brackett K F K and Brackett Robert S
Purchase Details
Closed on
Jul 18, 2011
Sold by
Grossman Paul A and Grossman Susan T
Bought by
Brackett Kathleen F
Purchase Details
Closed on
Aug 7, 1998
Sold by
Grossman Paul A
Bought by
Plonski Edward S and Plonski Florence I
Create a Home Valuation Report for This Property
The Home Valuation Report is an in-depth analysis detailing your home's value as well as a comparison with similar homes in the area
Home Values in the Area
Average Home Value in this Area
Purchase History
| Date | Buyer | Sale Price | Title Company |
|---|---|---|---|
| Perra Timothy R | $799,000 | None Available | |
| Perra Timothy R | $799,000 | None Available | |
| Brackett K F K | -- | -- | |
| Brackett K F K | -- | -- | |
| Brackett Kathleen F | $520,000 | -- | |
| Brackett Kathleen F | $520,000 | -- | |
| Plonski Edward S | $125,000 | -- | |
| Plonski Edward S | $125,000 | -- |
Source: Public Records
Tax History Compared to Growth
Tax History
| Year | Tax Paid | Tax Assessment Tax Assessment Total Assessment is a certain percentage of the fair market value that is determined by local assessors to be the total taxable value of land and additions on the property. | Land | Improvement |
|---|---|---|---|---|
| 2025 | $14,140 | $484,750 | $304,080 | $180,670 |
| 2024 | $13,205 | $484,750 | $304,080 | $180,670 |
| 2023 | $12,793 | $484,750 | $304,080 | $180,670 |
| 2022 | $11,346 | $338,280 | $178,260 | $160,020 |
| 2021 | $11,346 | $338,280 | $178,260 | $160,020 |
| 2020 | $11,346 | $338,280 | $178,260 | $160,020 |
| 2019 | $11,346 | $338,280 | $178,260 | $160,020 |
| 2018 | $11,233 | $334,920 | $178,260 | $156,660 |
| 2017 | $10,380 | $309,470 | $162,470 | $147,000 |
| 2016 | $9,962 | $297,010 | $162,470 | $134,540 |
| 2015 | $9,712 | $297,010 | $162,470 | $134,540 |
| 2014 | $9,478 | $297,010 | $162,470 | $134,540 |
Source: Public Records
Map
Nearby Homes