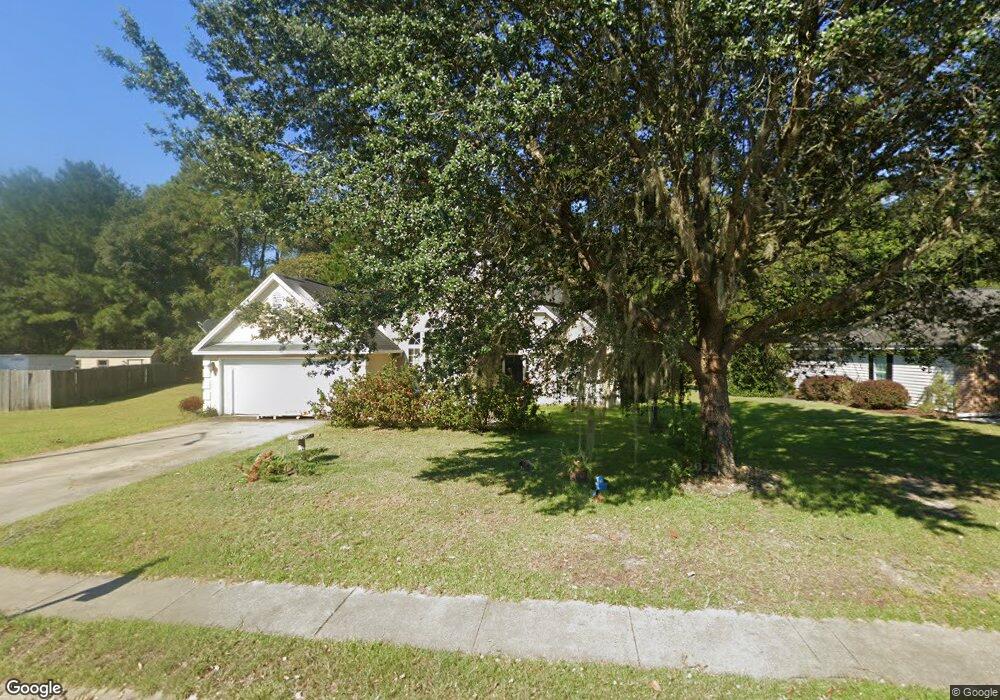
176 Silverton Rd Pooler, GA 31322
Estimated Value: $333,000 - $364,000
4
Beds
2
Baths
2,107
Sq Ft
$168/Sq Ft
Est. Value
About This Home
This home is located at 176 Silverton Rd, Pooler, GA 31322 and is currently estimated at $354,566, approximately $168 per square foot. 176 Silverton Rd is a home located in Chatham County with nearby schools including West Chatham Elementary School, West Chatham Middle School, and New Hampstead High School.
Ownership History
Date
Name
Owned For
Owner Type
Purchase Details
Closed on
Jul 6, 2022
Sold by
Acuna Randall G
Bought by
Adamson Cindy
Current Estimated Value
Home Financials for this Owner
Home Financials are based on the most recent Mortgage that was taken out on this home.
Original Mortgage
$85,000
Outstanding Balance
$62,707
Interest Rate
5.23%
Mortgage Type
New Conventional
Estimated Equity
$291,859
Purchase Details
Closed on
Jun 25, 2007
Sold by
Not Provided
Bought by
Acuna Randall G and Acuna Cindy E
Home Financials for this Owner
Home Financials are based on the most recent Mortgage that was taken out on this home.
Original Mortgage
$197,722
Interest Rate
6.35%
Mortgage Type
FHA
Purchase Details
Closed on
Feb 1, 2005
Sold by
Fred Williams Homebuilder Inc
Bought by
Owens Andrea W
Home Financials for this Owner
Home Financials are based on the most recent Mortgage that was taken out on this home.
Original Mortgage
$176,000
Interest Rate
8.75%
Mortgage Type
New Conventional
Create a Home Valuation Report for This Property
The Home Valuation Report is an in-depth analysis detailing your home's value as well as a comparison with similar homes in the area
Home Values in the Area
Average Home Value in this Area
Purchase History
| Date | Buyer | Sale Price | Title Company |
|---|---|---|---|
| Adamson Cindy | -- | -- | |
| Acuna Randall G | $200,000 | -- | |
| Owens Andrea W | $185,300 | -- | |
| Owens Andrea W | $185,275 | -- |
Source: Public Records
Mortgage History
| Date | Status | Borrower | Loan Amount |
|---|---|---|---|
| Open | Adamson Cindy | $85,000 | |
| Previous Owner | Acuna Randall G | $197,722 | |
| Previous Owner | Owens Andrea W | $176,000 |
Source: Public Records
Tax History Compared to Growth
Tax History
| Year | Tax Paid | Tax Assessment Tax Assessment Total Assessment is a certain percentage of the fair market value that is determined by local assessors to be the total taxable value of land and additions on the property. | Land | Improvement |
|---|---|---|---|---|
| 2025 | $2,743 | $143,640 | $24,000 | $119,640 |
| 2024 | $2,743 | $106,560 | $18,000 | $88,560 |
| 2023 | $2,305 | $110,440 | $18,000 | $92,440 |
| 2022 | $2,381 | $101,520 | $18,000 | $83,520 |
| 2021 | $2,422 | $74,560 | $10,000 | $64,560 |
| 2020 | $2,460 | $72,600 | $10,000 | $62,600 |
| 2019 | $2,460 | $77,120 | $10,000 | $67,120 |
| 2018 | $2,192 | $74,560 | $10,000 | $64,560 |
| 2017 | $2,179 | $74,200 | $10,000 | $64,200 |
| 2016 | $2,179 | $73,280 | $10,000 | $63,280 |
| 2015 | $2,217 | $640 | $0 | $0 |
| 2014 | $3,302 | $74,880 | $0 | $0 |
Source: Public Records
Map
Nearby Homes
- 80 Woodford Reserve Dr
- 81 Woodford Reserve Dr
- 33 Woodford Reserve Dr
- 301 Merganser Dr
- 10 Cassidy Ct
- 14 Woodford Reserve Dr
- 30 Melody Dr
- 32 Melody Dr
- 3 Woodford Reserve Dr
- 24 Chamois Ct
- 114 Holloway Hill
- 134 Holloway Hill
- 126 Holloway Hill
- 223 Longleaf Cir
- 7 Tranquil Place
- 120 Melody Dr
- 111 Ashwood Dr
- 10 Mackinac Ct
- 128 Melody Dr
- 135 Melody Dr
- 178 Silverton Rd
- 174 Silverton Rd
- 175 Silverton Rd
- 180 Silverton Rd
- 172 Silverton Rd
- 179 Silverton Rd
- 169 Silverton Rd
- 182 Silverton Rd
- 170 Silverton Rd
- 181 Silverton Rd
- 168 Silverton Rd
- 167 Silverton Rd
- 183 Silverton Rd
- 13 Platinum Ct
- 11 Platinum Ct
- 72 Woodford Reserve Dr
- 166 Silverton Rd
- 70 Woodford Reserve Dr
- 76 Woodford Reserve Dr
- 185 Silverton Rd