176 South Rd Somers, CT 06071
Estimated Value: $405,000 - $417,000
3
Beds
3
Baths
1,568
Sq Ft
$263/Sq Ft
Est. Value
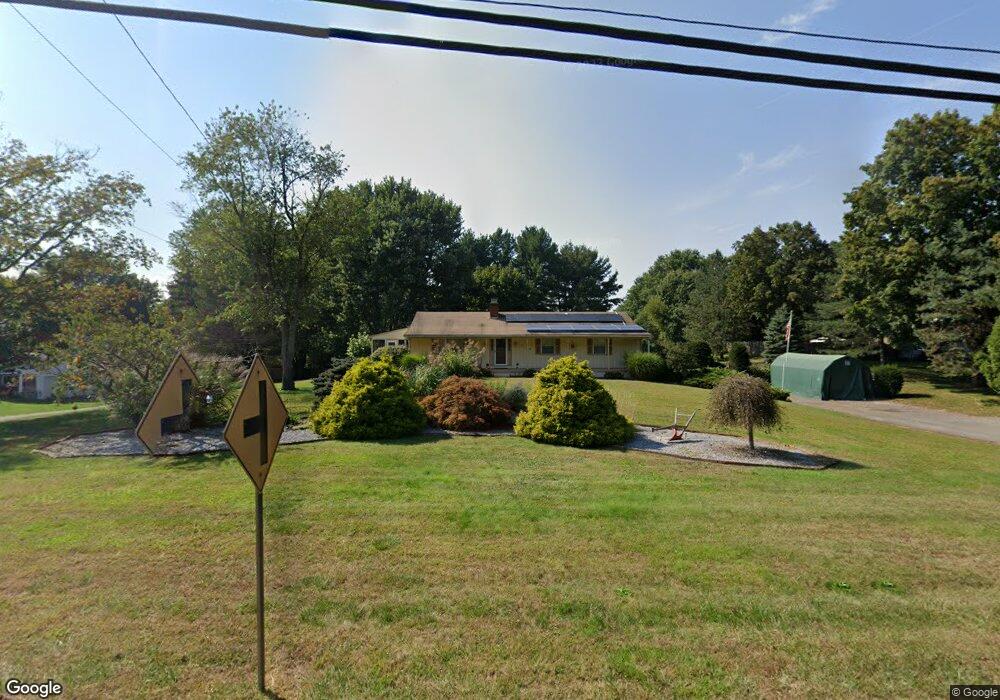
About This Home
This home is located at 176 South Rd, Somers, CT 06071 and is currently estimated at $411,691, approximately $262 per square foot. 176 South Rd is a home located in Tolland County with nearby schools including Somers Elementary School, Mabelle B. Avery Middle School, and Somers High School.
Ownership History
Date
Name
Owned For
Owner Type
Purchase Details
Closed on
May 27, 1994
Sold by
Mcconville Brian and Mcconville Janet
Bought by
Stahouski Glenn and Stahouski Christine
Current Estimated Value
Purchase Details
Closed on
May 2, 1988
Sold by
Phelps Brian W
Bought by
Mcconville Brian S
Create a Home Valuation Report for This Property
The Home Valuation Report is an in-depth analysis detailing your home's value as well as a comparison with similar homes in the area
Home Values in the Area
Average Home Value in this Area
Purchase History
| Date | Buyer | Sale Price | Title Company |
|---|---|---|---|
| Stahouski Glenn | $143,000 | -- | |
| Stahouski Glenn | $143,000 | -- | |
| Mcconville Brian S | $171,900 | -- |
Source: Public Records
Mortgage History
| Date | Status | Borrower | Loan Amount |
|---|---|---|---|
| Open | Mcconville Brian S | $192,072 | |
| Closed | Mcconville Brian S | $207,000 | |
| Closed | Mcconville Brian S | $165,600 |
Source: Public Records
Tax History Compared to Growth
Tax History
| Year | Tax Paid | Tax Assessment Tax Assessment Total Assessment is a certain percentage of the fair market value that is determined by local assessors to be the total taxable value of land and additions on the property. | Land | Improvement |
|---|---|---|---|---|
| 2025 | $5,033 | $166,600 | $55,900 | $110,700 |
| 2024 | $4,825 | $166,600 | $55,900 | $110,700 |
| 2023 | $4,716 | $166,600 | $55,900 | $110,700 |
| 2022 | $4,591 | $166,600 | $55,900 | $110,700 |
| 2021 | $4,442 | $166,600 | $55,900 | $110,700 |
| 2020 | $4,508 | $164,700 | $55,900 | $108,800 |
| 2019 | $4,327 | $158,100 | $60,000 | $98,100 |
| 2018 | $4,327 | $158,100 | $60,000 | $98,100 |
| 2017 | $4,027 | $158,100 | $60,000 | $98,100 |
| 2016 | $3,829 | $158,100 | $60,000 | $98,100 |
| 2015 | $3,791 | $162,200 | $63,200 | $99,000 |
| 2014 | $3,791 | $162,200 | $63,200 | $99,000 |
Source: Public Records
Map
Nearby Homes