
Seller's Agent in 2020
Mckenzie Howarth
Coldwell Banker Realty - Newton
(617) 969-2447
103 Total Sales
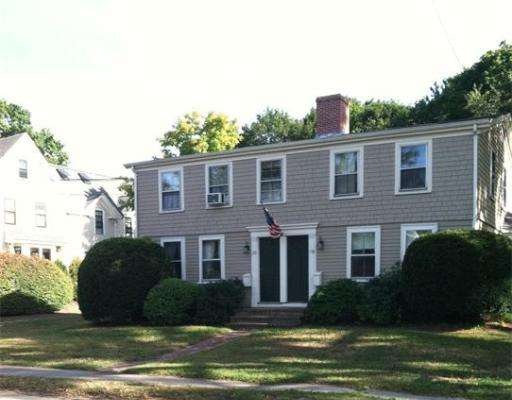
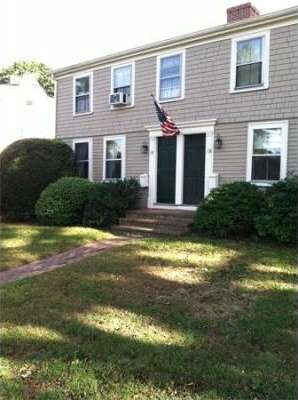
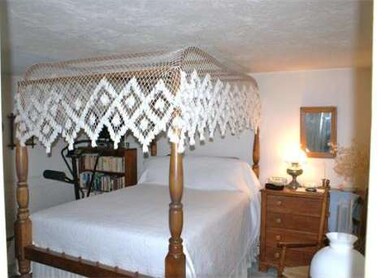
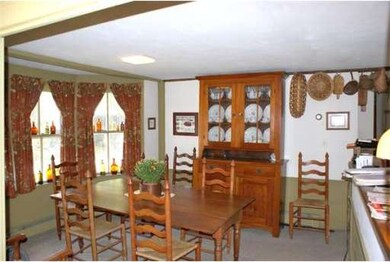
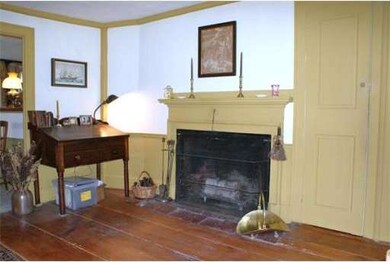
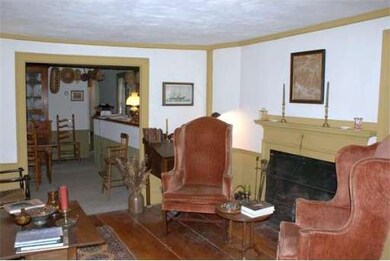
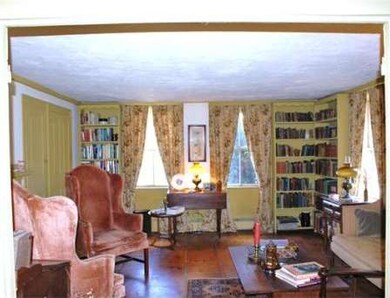
Great location!!!!!... Walk to the train from this desired Downtown Hingham location close to shopping, restaurants, Harbor, and all that Hingham Square has to offer. Spacious TWO bedroom condo with over one thousand square feet of living space with wide pine floors, built in bookcase and fireplace in living room which opens up to to large dining room and kitchen area.
Home Type
Condominium
Est. Annual Taxes
$4,626
Year Built
1850
Lot Details
0
| Date | Type | Sale Price | Title Company |
|---|---|---|---|
| Condominium Deed | $406,000 | None Available | |
| Deed | -- | -- | |
| Not Resolvable | $232,900 | -- |
| Date | Status | Loan Amount | Loan Type |
|---|---|---|---|
| Open | $124,000 | New Conventional |
| Date | Event | Price | Change | Sq Ft Price |
|---|---|---|---|---|
| 02/28/2020 02/28/20 | Sold | $406,000 | +10.0% | $480 / Sq Ft |
| 01/20/2020 01/20/20 | Pending | -- | -- | -- |
| 01/16/2020 01/16/20 | For Sale | $369,000 | +58.4% | $436 / Sq Ft |
| 10/21/2013 10/21/13 | Sold | $232,900 | 0.0% | $205 / Sq Ft |
| 10/03/2013 10/03/13 | Pending | -- | -- | -- |
| 09/19/2013 09/19/13 | Off Market | $232,900 | -- | -- |
| 08/14/2013 08/14/13 | For Sale | $239,900 | +3.0% | $211 / Sq Ft |
| 08/11/2013 08/11/13 | Off Market | $232,900 | -- | -- |
| 07/13/2013 07/13/13 | Price Changed | $239,900 | -7.4% | $211 / Sq Ft |
| 11/15/2012 11/15/12 | Price Changed | $259,000 | -4.0% | $228 / Sq Ft |
| 09/24/2012 09/24/12 | For Sale | $269,900 | -- | $237 / Sq Ft |
| Year | Tax Paid | Tax Assessment Tax Assessment Total Assessment is a certain percentage of the fair market value that is determined by local assessors to be the total taxable value of land and additions on the property. | Land | Improvement |
|---|---|---|---|---|
| 2025 | $4,626 | $432,700 | $0 | $432,700 |
| 2024 | $4,695 | $432,700 | $0 | $432,700 |
| 2023 | $3,993 | $399,300 | $0 | $399,300 |
| 2022 | $4,374 | $378,400 | $0 | $378,400 |
| 2021 | $4,347 | $368,400 | $0 | $368,400 |
| 2020 | $3,952 | $342,800 | $0 | $342,800 |
| 2019 | $3,304 | $279,800 | $0 | $279,800 |
| 2018 | $3,130 | $265,900 | $0 | $265,900 |
| 2017 | $2,955 | $241,200 | $0 | $241,200 |
| 2016 | $2,896 | $231,900 | $0 | $231,900 |
| 2015 | $2,867 | $228,800 | $0 | $228,800 |
Seller's Agent in 2020
Mckenzie Howarth
Coldwell Banker Realty - Newton
(617) 969-2447
103 Total Sales
Buyer's Agent in 2020
The iBremis Team
Laer Realty
(617) 905-5232
34 Total Sales
Seller's Agent in 2013
Lisa Coyne
Coldwell Banker Realty - Hingham
(508) 274-9769
54 Total Sales
Buyer's Agent in 2013
Rick and Pam Adami
Keller Williams Coastal and Lakes & Mountains Realty
(781) 901-1561
47 Total Sales
Source: MLS Property Information Network (MLS PIN)
MLS Number: 71439107
APN: HING-000060-000001-000100
Disclaimer: Certain information contained herein is derived from information provided by parties other than Homes.com. All information provided is deemed reliable, but is not guaranteed to be accurate and should be independently verified.
![]() The property listing data and information, or the Images, set forth herein were provided to MLS Property Information Network, Inc. from third party sources, including sellers, lessors and public records, and were compiled by MLS Property Information Network, Inc. The property listing data and information, and the Images, are for the personal, non-commercial use of consumers having a good faith interest in purchasing or leasing listed properties of the type displayed to them and may not be used for any purpose other than to identify prospective properties which such consumers may have a good faith interest in purchasing or leasing. MLS Property Information Network, Inc. and its subscribers disclaim any and all representations and warranties as to the accuracy of the property listing data and information, or as to the accuracy of any of the Images, set forth herein.
The property listing data and information, or the Images, set forth herein were provided to MLS Property Information Network, Inc. from third party sources, including sellers, lessors and public records, and were compiled by MLS Property Information Network, Inc. The property listing data and information, and the Images, are for the personal, non-commercial use of consumers having a good faith interest in purchasing or leasing listed properties of the type displayed to them and may not be used for any purpose other than to identify prospective properties which such consumers may have a good faith interest in purchasing or leasing. MLS Property Information Network, Inc. and its subscribers disclaim any and all representations and warranties as to the accuracy of the property listing data and information, or as to the accuracy of any of the Images, set forth herein.