B
Seller's Agent in 2020
Bonnie Handrahan
Hingham Real Estate Co.
11 Total Sales
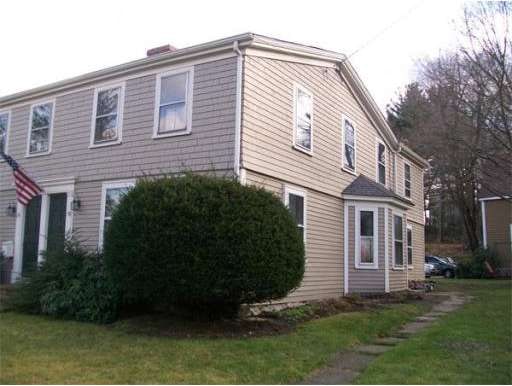
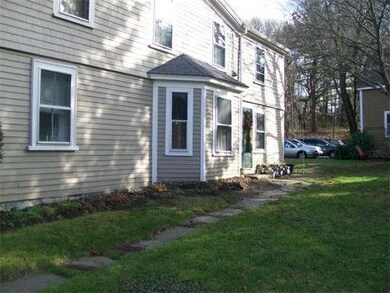
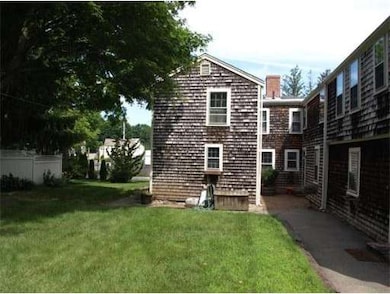
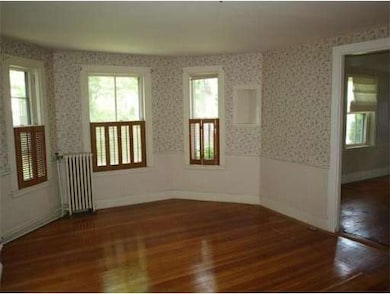
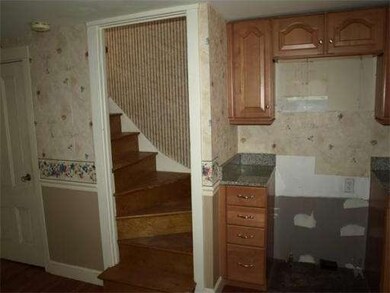

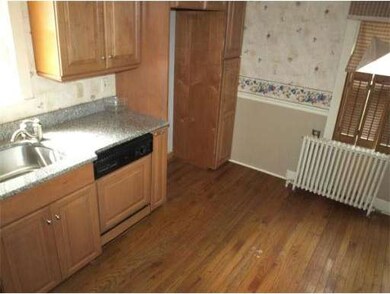
Freddie Mac Foreclosure, Sold "as is", 4 unit complex, 6 room, 3 bedroom, townhouse, walk to Hingham Square, opportunity to purchase a downtown location condominium with over 1300 sq.ft. of living space. Rare opportunity. All Offers must be accompanied by pre-approval and offer checklist. Owner occupied buyers only for the 1st 15 days of this listing.
Last Agent to Sell the Property
Mary Mccready
Conway - Hingham License #455500042 Listed on: 07/26/2012
Last Buyer's Agent
Sheilah Colpoys
Conway - Hingham

Home Type
Condominium
Est. Annual Taxes
$5,369
Year Built
1750
Lot Details
0
| Date | Type | Sale Price | Title Company |
|---|---|---|---|
| Quit Claim Deed | -- | None Available | |
| Not Resolvable | $450,000 | -- | |
| Quit Claim Deed | $255,000 | -- | |
| Quit Claim Deed | $255,000 | -- | |
| Not Resolvable | $235,000 | -- | |
| Foreclosure Deed | $231,524 | -- | |
| Deed | -- | -- | |
| Deed | $165,000 | -- |
| Date | Status | Loan Amount | Loan Type |
|---|---|---|---|
| Previous Owner | $290,000 | New Conventional | |
| Previous Owner | $204,000 | New Conventional | |
| Previous Owner | $300,000 | No Value Available | |
| Previous Owner | $278,000 | Purchase Money Mortgage | |
| Previous Owner | $156,750 | Purchase Money Mortgage |
| Date | Event | Price | Change | Sq Ft Price |
|---|---|---|---|---|
| 08/28/2020 08/28/20 | Sold | $280,000 | -3.4% | $602 / Sq Ft |
| 07/29/2020 07/29/20 | Pending | -- | -- | -- |
| 06/28/2020 06/28/20 | Price Changed | $289,900 | -3.3% | $623 / Sq Ft |
| 05/23/2020 05/23/20 | For Sale | $299,900 | 0.0% | $645 / Sq Ft |
| 03/13/2018 03/13/18 | Rented | $1,450 | 0.0% | -- |
| 03/10/2018 03/10/18 | Price Changed | $1,450 | -3.3% | $3 / Sq Ft |
| 02/10/2018 02/10/18 | For Rent | $1,500 | 0.0% | -- |
| 01/01/2018 01/01/18 | Rented | $1,500 | +3.4% | -- |
| 11/24/2017 11/24/17 | Under Contract | -- | -- | -- |
| 11/09/2017 11/09/17 | Price Changed | $1,450 | 0.0% | $3 / Sq Ft |
| 11/09/2017 11/09/17 | For Rent | $1,450 | -3.3% | -- |
| 11/03/2017 11/03/17 | Off Market | $1,500 | -- | -- |
| 11/01/2017 11/01/17 | Under Contract | -- | -- | -- |
| 10/22/2017 10/22/17 | For Rent | $1,500 | 0.0% | -- |
| 10/14/2017 10/14/17 | Under Contract | -- | -- | -- |
| 08/25/2017 08/25/17 | For Rent | $1,500 | 0.0% | -- |
| 10/26/2012 10/26/12 | Sold | $235,000 | -4.0% | $178 / Sq Ft |
| 10/04/2012 10/04/12 | Pending | -- | -- | -- |
| 09/27/2012 09/27/12 | Price Changed | $244,900 | -12.5% | $185 / Sq Ft |
| 08/27/2012 08/27/12 | Price Changed | $280,000 | -11.1% | $212 / Sq Ft |
| 07/26/2012 07/26/12 | For Sale | $315,000 | -- | $238 / Sq Ft |
| Year | Tax Paid | Tax Assessment Tax Assessment Total Assessment is a certain percentage of the fair market value that is determined by local assessors to be the total taxable value of land and additions on the property. | Land | Improvement |
|---|---|---|---|---|
| 2025 | $5,369 | $502,200 | $0 | $502,200 |
| 2024 | $5,449 | $502,200 | $0 | $502,200 |
| 2023 | $4,635 | $463,500 | $0 | $463,500 |
| 2022 | $5,079 | $439,400 | $0 | $439,400 |
| 2021 | $5,048 | $427,800 | $0 | $427,800 |
| 2020 | $4,933 | $427,800 | $0 | $427,800 |
| 2019 | $4,130 | $349,700 | $0 | $349,700 |
| 2018 | $3,912 | $332,400 | $0 | $332,400 |
| 2017 | $3,666 | $299,300 | $0 | $299,300 |
| 2016 | $3,595 | $287,800 | $0 | $287,800 |
| 2015 | $3,559 | $284,000 | $0 | $284,000 |
B
Seller's Agent in 2020
Bonnie Handrahan
Hingham Real Estate Co.
11 Total Sales
Buyer's Agent in 2020
Molly Hall
Coldwell Banker Realty - Hingham
(617) 571-2007
69 Total Sales
M
Seller's Agent in 2012
Mary Mccready
Conway - Hingham
S
Buyer's Agent in 2012
Sheilah Colpoys
Conway - Hingham
Source: MLS Property Information Network (MLS PIN)
MLS Number: 71414756
APN: HING-000060-000004-000100
Disclaimer: Certain information contained herein is derived from information provided by parties other than Homes.com. All information provided is deemed reliable, but is not guaranteed to be accurate and should be independently verified.
![]() The property listing data and information, or the Images, set forth herein were provided to MLS Property Information Network, Inc. from third party sources, including sellers, lessors and public records, and were compiled by MLS Property Information Network, Inc. The property listing data and information, and the Images, are for the personal, non-commercial use of consumers having a good faith interest in purchasing or leasing listed properties of the type displayed to them and may not be used for any purpose other than to identify prospective properties which such consumers may have a good faith interest in purchasing or leasing. MLS Property Information Network, Inc. and its subscribers disclaim any and all representations and warranties as to the accuracy of the property listing data and information, or as to the accuracy of any of the Images, set forth herein.
The property listing data and information, or the Images, set forth herein were provided to MLS Property Information Network, Inc. from third party sources, including sellers, lessors and public records, and were compiled by MLS Property Information Network, Inc. The property listing data and information, and the Images, are for the personal, non-commercial use of consumers having a good faith interest in purchasing or leasing listed properties of the type displayed to them and may not be used for any purpose other than to identify prospective properties which such consumers may have a good faith interest in purchasing or leasing. MLS Property Information Network, Inc. and its subscribers disclaim any and all representations and warranties as to the accuracy of the property listing data and information, or as to the accuracy of any of the Images, set forth herein.